
Gold Falls After Hot US CPI: Why Treasury Yields and the Dollar Surged
Why is gold falling after today’s US CPI report?
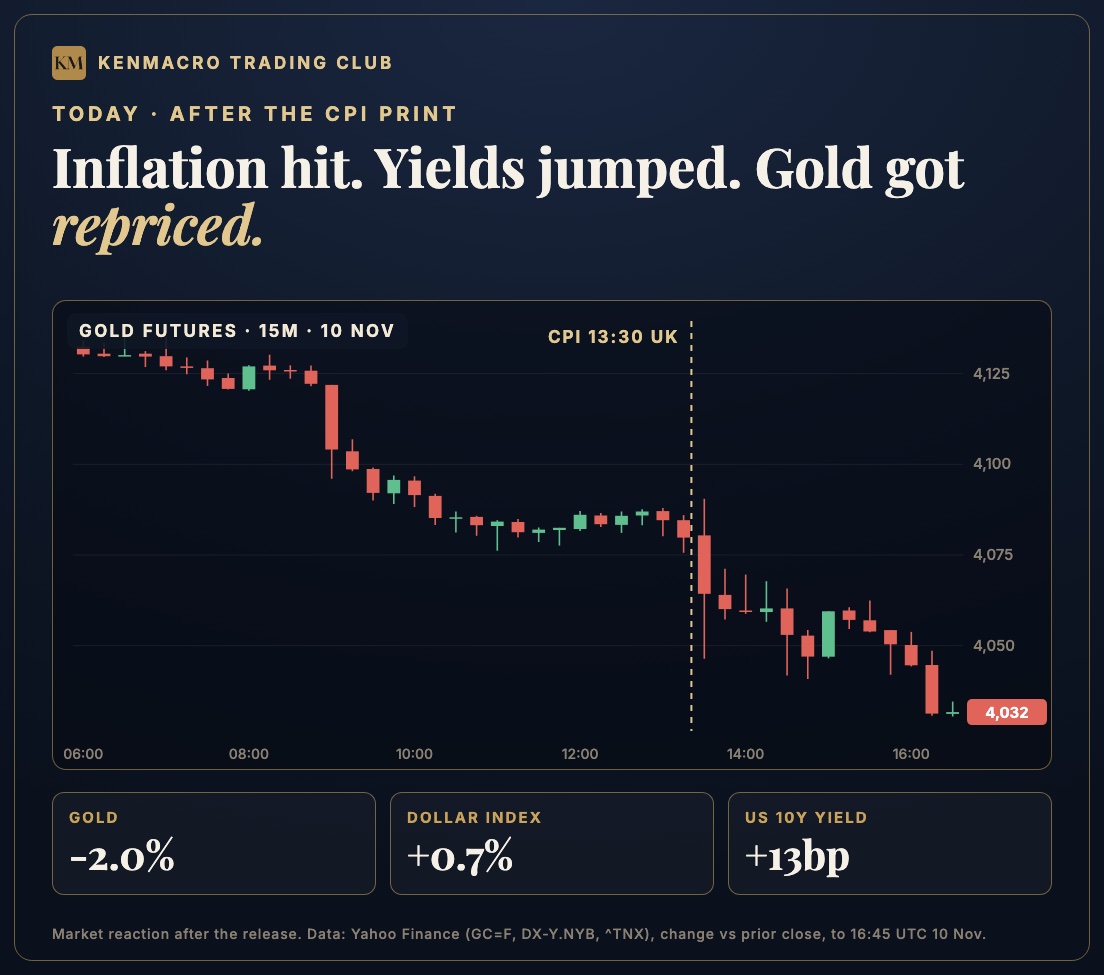
Gold fell sharply on Tuesday, 10 November 2026, after US inflation beat expectations and triggered a rapid repricing of Federal Reserve rate expectations. Headline CPI rose 0.4% in October against forecasts of 0.3%, and core CPI, which strips out food and energy, rose 0.3% against 0.2%. The response was immediate: Treasury yields surged, particularly at the short end of the curve, the dollar strengthened across the majors and gold lost more than 2%.
And this is exactly where a lot of traders get CPI completely wrong. They see inflation come in hot and assume gold should rally, because gold is an inflation hedge, right? Over longer periods gold can protect against monetary uncertainty, but that doesn’t mean it rallies every time inflation surprises to the upside.
The market wasn’t simply trading inflation today. It was trading what inflation means for the Federal Reserve.
US CPI November 2026: the numbers that moved markets
Here are the key figures from the Bureau of Labor Statistics’ October inflation report, published at 13:30 UK on 10 November.
| Measure | Actual | Forecast |
|---|---|---|
| Headline CPI | +0.4% | +0.3% |
| Core CPI (ex food and energy) | +0.3% | +0.2% |
| Headline CPI, September | +0.6% | Prior month |
| Energy CPI, October | +0.7% | After +5.2% in September |
| Food CPI, October | +0.5% | Not forecast |
There’s an important distinction here. Headline inflation actually slowed from September’s 0.6%, but it didn’t slow as much as the market expected. Core inflation rose 0.3% for the third month running, matching August and September, so the underlying trend simply isn’t cooling.
Shelter rose 0.3% and accounted for over 30% of the monthly increase, food rose 0.5%, and medical care, recreation and motor vehicle insurance all added to core. Some pressures are easing, but there was nowhere near enough evidence of a convincing return to price stability, and for a Fed already worried about persistent inflation that matters enormously. Forecasts are market consensus estimates, not BLS figures.
We were preparing for the inflation risk before the release
This goes right to the heart of how I approach trading. On my live session on Monday 9 November, the day before CPI, we were already working through the inflation risk. We weren’t looking at the calendar and waiting for a number to appear; we were asking what was happening in the economy that could push the reading higher.
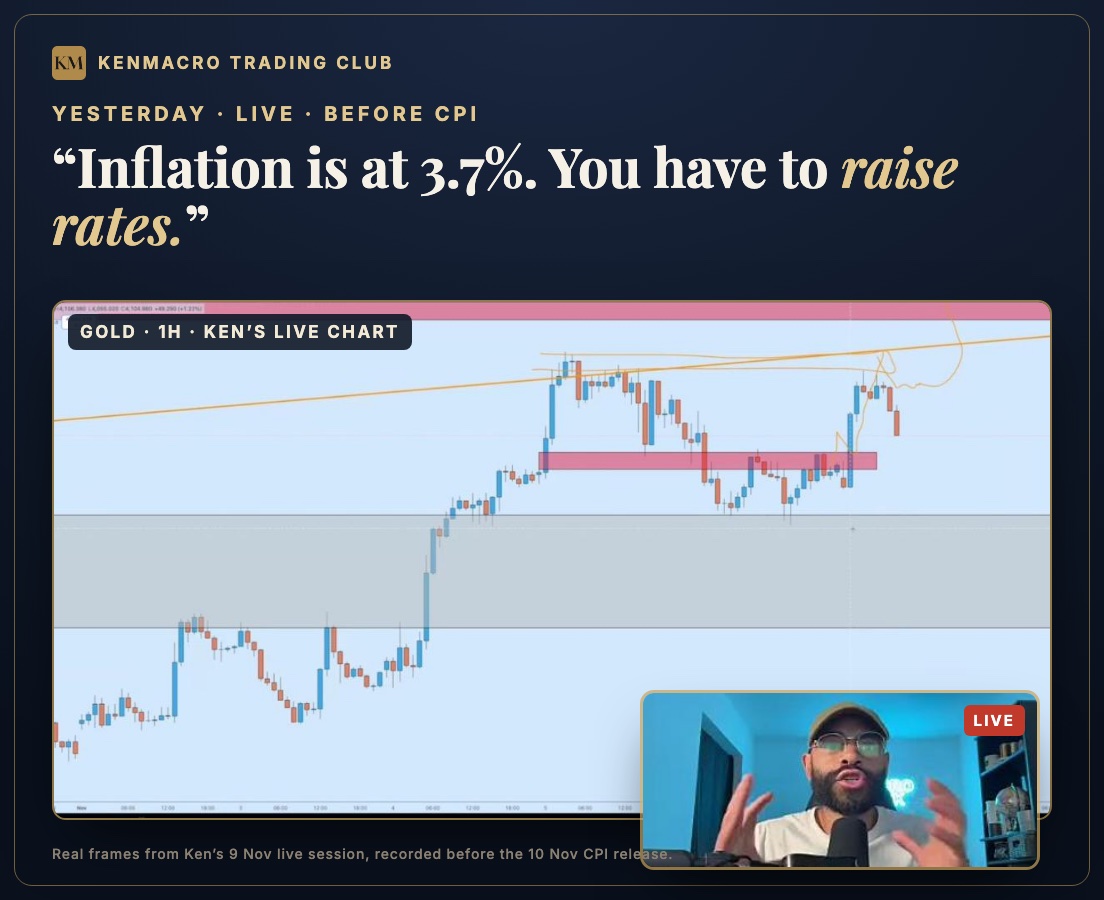
Energy was a big part of that. WTI crude rose about 15% across October on front-month futures, from $90.42 at the end of September to $104.12 on 30 October, and close to 18% from its 7 October low. The energy CPI index had already surged 5.2% in September and rose another 0.7% in October, and higher fuel and transport costs raise real questions about how much of that feeds through to everything else.
But energy isn’t the whole inflation story. You also need to watch how sticky core prices are, the housing components, services and the wider economy, which is why we never build a trading plan around one headline. Energy, inflation, central banks, bond yields, currency flows and gold are all part of the same picture, and our job before an event like this is to know which outcomes are possible and what each one would do to the market.
That doesn’t mean knowing the CPI number in advance. It means not being caught unprepared when it lands.
Why US Treasury yields surged after CPI
This is arguably the most important part of today’s move. After the release the Treasury market sold off hard, and remember, when bond prices fall their yields rise. The 10-year briefly traded above 5%.
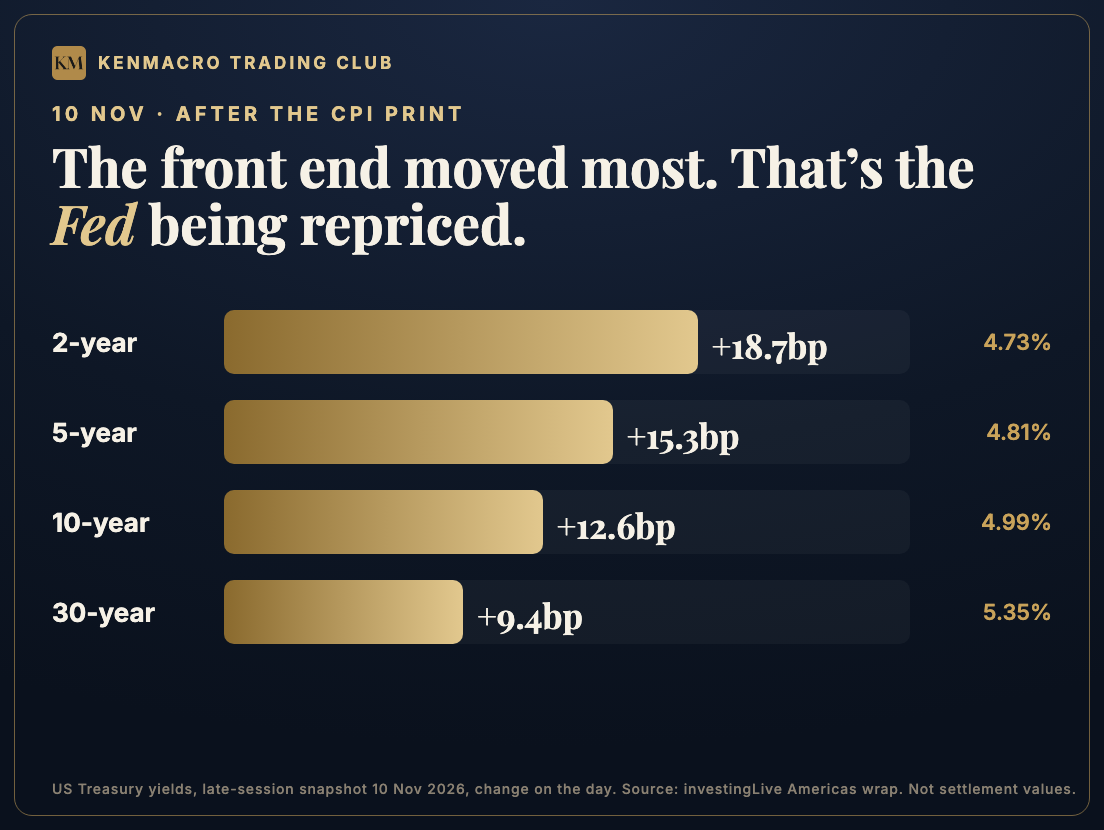
| Maturity | Yield | Daily change |
|---|---|---|
| 2-year | 4.7335% | +18.65bp |
| 5-year | 4.8121% | +15.31bp |
| 10-year | 4.9875% | +12.55bp |
| 30-year | 5.3502% | +9.42bp |
Notice that the 2-year and 5-year moved the most, and that’s no coincidence. The short end of the curve is the part most sensitive to Federal Reserve policy expectations, so when investors suddenly believe the Fed may need to tighten more aggressively, that’s where you see it first. It’s why I’m constantly watching the 2-year and 5-year on our live sessions: they tell us what the bond market is pricing into future policy.
Today the message was clear. Inflation is still a problem, and further tightening may be needed. That repricing matters far beyond bonds, because it changes the relative attraction of holding currencies, equities, commodities and gold.
The Fed: why December just got more interesting
Before CPI was even published, Federal Reserve Governor Christopher Waller had laid down a marker. Speaking in London on 10 November, he said that even if inflation improved, he “would still support a 25 basis point increase in the FOMC’s policy rate at our December meeting.” He went further: with “core CPI inflation around 0.3 percent or even higher,” he said, “a 50 basis point hike in the policy rate should be considered at the December meeting.”
Core CPI landed at exactly 0.3%. After the release, market pricing put a 25 basis point December hike at about 90% and a 50 basis point move at about 10%, so a hike is effectively priced in and the debate has moved to its size. The fed funds target range is currently 3.75% to 4.00%, after the Fed held on 28 October with two dissents in favour of a hike.
None of that makes 50 basis points a done deal, and one governor doesn’t decide policy for the whole committee. But it explains why this report carried so much weight. When the expected path of interest rates moves, everything else starts reacting.
Why the US dollar strengthened
When investors expect US rates to rise relative to everywhere else, dollar assets become more attractive and that can lift demand for the dollar. It isn’t automatic and other factors matter, but the relative rate outlook is one of the biggest drivers in currency markets. On Tuesday the dollar index gained about 0.7%, and late-session reporting showed EUR/USD down about 0.55%, GBP/USD down 0.75%, AUD/USD down 0.91% and USD/JPY up 0.55%.
That’s one US inflation report moving currencies across the world. It’s also why trading EUR/USD, GBP/USD or gold without understanding the Fed and Treasury yields leaves you missing a huge part of the picture. A technical level might tell you where price could react, and the macro tells you why capital is moving. I want to understand both.
Why gold fell despite higher inflation
Here’s where it gets really interesting. Gold doesn’t pay interest and Treasuries do, so when the return available from interest-bearing assets rises, the opportunity cost of holding gold rises with it. For gold, though, real yields matter more than nominal yields alone, and a real yield is the return on a bond after expected inflation.
If hot CPI makes investors expect the Fed to tighten harder, nominal yields can rise faster than inflation expectations, which pushes real yields higher, and rising real yields often weigh on gold. Add a stronger dollar on top and you’ve got two major headwinds for the metal at the same time.
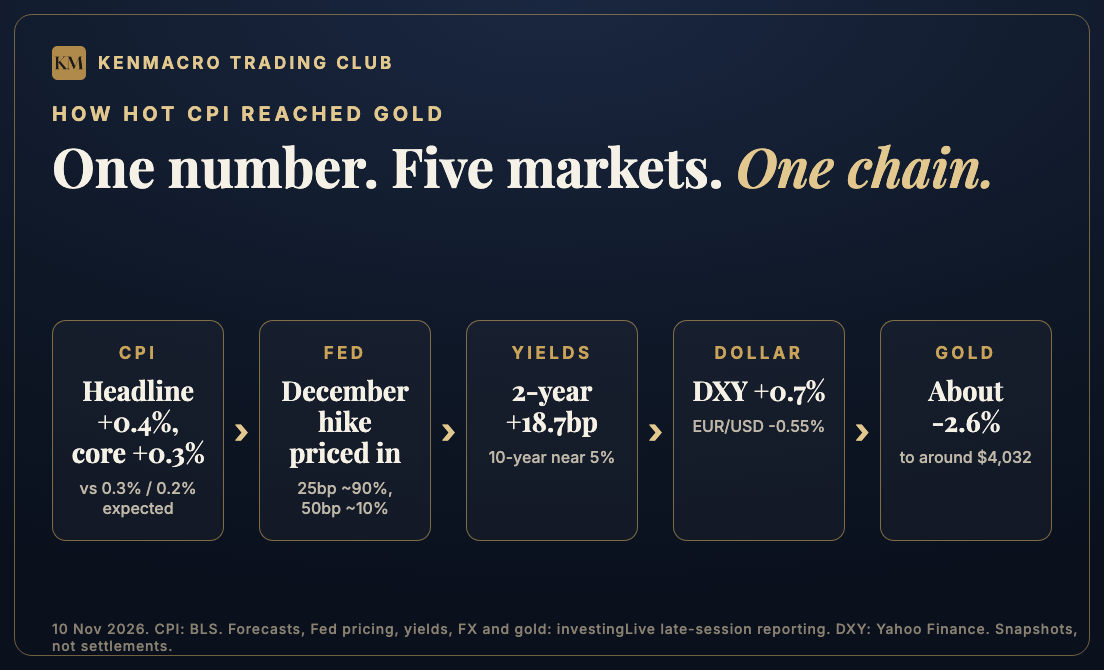
Hot CPI, then more hawkish Fed expectations, then higher Treasury yields, then a stronger dollar, then pressure on gold. It’s not a rule that works every single time, but today it explains a large part of the move. I’ve broken the same mechanism down in why gold can fall during a war, and my guide to trading CPI covers how to prepare for the release itself.
What happens to gold next? My technical roadmap
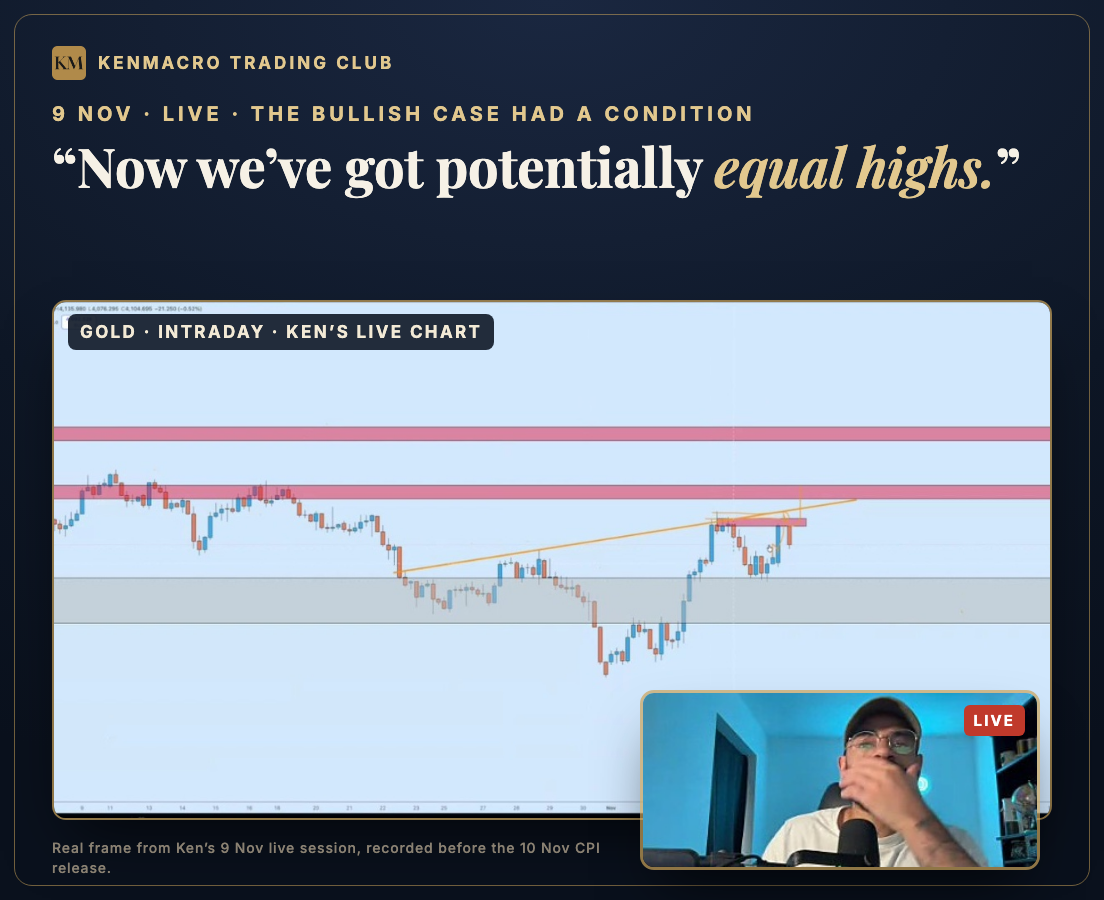
Now let’s bring the technicals into it, because yesterday gold was presenting a genuine potential bullish reversal. On the weekly chart, price had faked out below the $4,000 liquidity area and the weekly candle was building a big bullish engulfing, and on the lower timeframes I was watching for an inverse head and shoulders to develop.
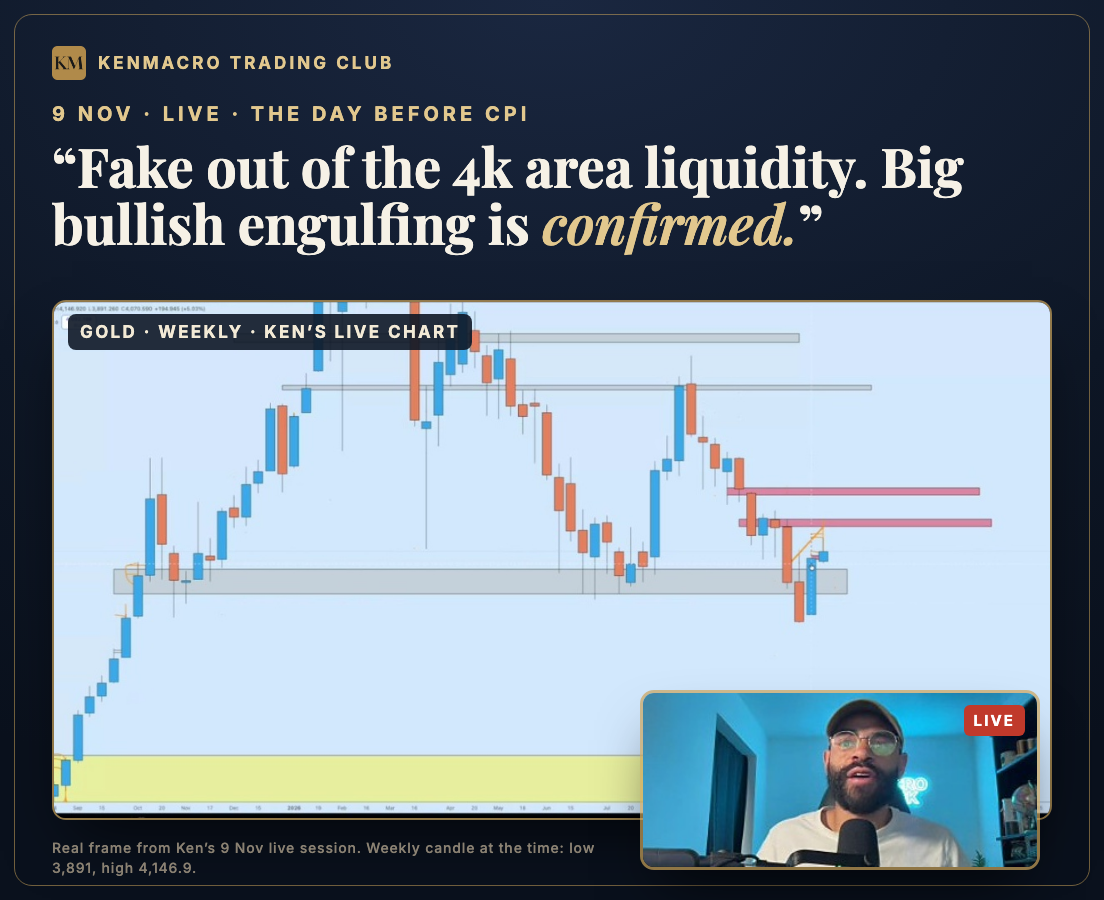
The bullish case was worth watching, but it came with a condition: the macro had to support it. I also flagged potentially equal highs under resistance, which is exactly the kind of structure that can turn a recovery into a failure. Today’s inflation surprise made the bullish condition much harder to meet.
Scenario 1: bearish continuation
If Treasury yields stay elevated, the dollar keeps strengthening and gold fails to reclaim nearby resistance, the risk of a further decline stays on the table. The $4,000 region is the key area to monitor, and a sustained break below it would raise the probability of a lower low. The precise next support depends on how the structure develops from here.
Scenario 2: bullish recovery
I’m not abandoning the broader possibility of a gold recovery, but I need evidence. That means sellers losing control, yields and the dollar starting to soften, and gold reclaiming resistance. The liquidity up around $4,200 that I marked on the session remains the level for the upside case, and that’s a conditional scenario, not my assumption after today’s sell-off.
Scenario 3: the market stays trapped
There’s another possibility traders often overlook. Gold could simply stay volatile and directionless while the market reassesses inflation, the Fed and the geopolitics. Sometimes the best decision is not forcing a trade, and what matters is having conditions for each scenario rather than deciding the market owes you an outcome. For the ongoing levels, see my gold price forecast.
The biggest trading lesson from today’s CPI shock
I’ve been in financial markets for 18 years. I started young, worked on institutional trading floors in the City of London and eventually moved into full-time trading and education, and one thing I keep coming back to is this: you cannot afford to fall in love with a market bias.
Yesterday’s technical setup doesn’t become a good trade just because you spent hours analysing it, and today’s bearish move doesn’t mean gold can never rally again. The evidence changes, so the analysis has to change with it. That’s what I try to teach throughout my education: not just where a support level sits or how to spot an engulfing candle, but how to understand the environment that gives those setups context.
How to read economic data, interpret central bank language and understand why bond yields are moving. How to connect those developments to currencies, gold, oil and equities. And, critically, how to manage your risk when the conditions don’t play out the way you expected.
I don’t believe useful market education is somebody posting a buy or sell arrow with no explanation. When I share a trade idea, I want you to understand why I’m interested, what evidence supports the view, what would invalidate it and why I might change my mind. That’s the process I want traders to build for themselves.
My final thoughts: don’t just watch the move, understand it
Today’s CPI report was a reminder of something I talk about constantly: the chart is only one part of the story. Gold can look technically bullish, then an inflation report arrives, Treasury yields surge, the dollar strengthens and the whole picture changes.
The traders who understand why that happened have a better foundation for deciding what to do next. It doesn’t make them immune to losses or guarantee they’ll get the next trade right, but it means they’re approaching the market with a framework instead of a guess.
Understand the macro. Read the chart. Manage the risk. Adapt when the evidence changes.
- Live New York sessions with me, Monday to Friday at 14:00 UK
- Every session recorded, with chapters and a written breakdown
- The education library while you’re subscribed
- The community, plus the Structure Desk indicator on request
- All 5 courses, 116 lessons, yours for life, including the Macro Trading Blueprint
- 12 months in the Trading Club included
- One private one-to-one session with me
- No subscription and no auto-renewal
Follow-up, 17 November: gold is still under pressure even as Iran tensions escalate. Read why gold is falling despite the Iran war, with retail sales, real yields near 3% and the Fed outlook.
Frequently asked questions
Why did gold fall when US inflation increased?
Gold fell because hotter-than-expected October CPI increased expectations of tighter Federal Reserve policy. The 2-year Treasury yield rose about 18.7 basis points and the dollar index about 0.7% on 10 November 2026, which raised the opportunity cost of holding non-yielding gold. Spot gold fell about 2.6% to around $4,032.
What was the October 2026 US CPI figure?
Headline CPI rose 0.4% month on month and core CPI rose 0.3%, against forecasts of 0.3% and 0.2%. Energy rose 0.7% and food 0.5%. The Bureau of Labor Statistics published the report on 10 November 2026, and core has now risen 0.3% for three months in a row.
Why do Treasury yields rise after a hot CPI report?
Hotter inflation makes investors expect higher central bank interest rates, so bond prices fall and yields rise to reflect that path. The 2-year yield is the most sensitive to the Fed’s expected policy, which is why it rose the most on 10 November, by about 18.7 basis points to 4.73%.
Is a December Fed rate hike guaranteed?
No. After the CPI release, market pricing put a 25 basis point December hike at about 90% and a 50 basis point hike at about 10%, but the FOMC decides on the evidence at the meeting. Governor Waller said on 10 November that a 50 basis point hike should be considered if core CPI ran around 0.3% or higher.
Does higher inflation always mean lower gold prices?
No. Gold’s reaction depends on what inflation does to expected Fed policy, real yields, the dollar and risk appetite. Gold can rise during inflationary periods, but it can fall when inflation makes rate expectations more hawkish, as it did on 10 November 2026.
What should traders watch after the CPI release?
Watch the 2-year and 5-year Treasury yields, US real yields, the dollar index, December Fed pricing and how gold behaves around the $4,000 area and resistance near $4,200. Together they show whether the hawkish repricing is extending or fading.
Get the macro framework the desk actually trades
The same regime-first framework behind every call on this site. Free. No spam, unsubscribe anytime.
Continue reading
From the desk
Part of the Gold Forecast hub, the desk’s living guide, kept current as markets move.
Where this gets traded
If you trade gold (XAU/USD) around real-yield shifts, CPI or FOMC, execution quality decides the fill. See the KenMacro desk guide to the best brokers for trading gold.
Read the desk guide →