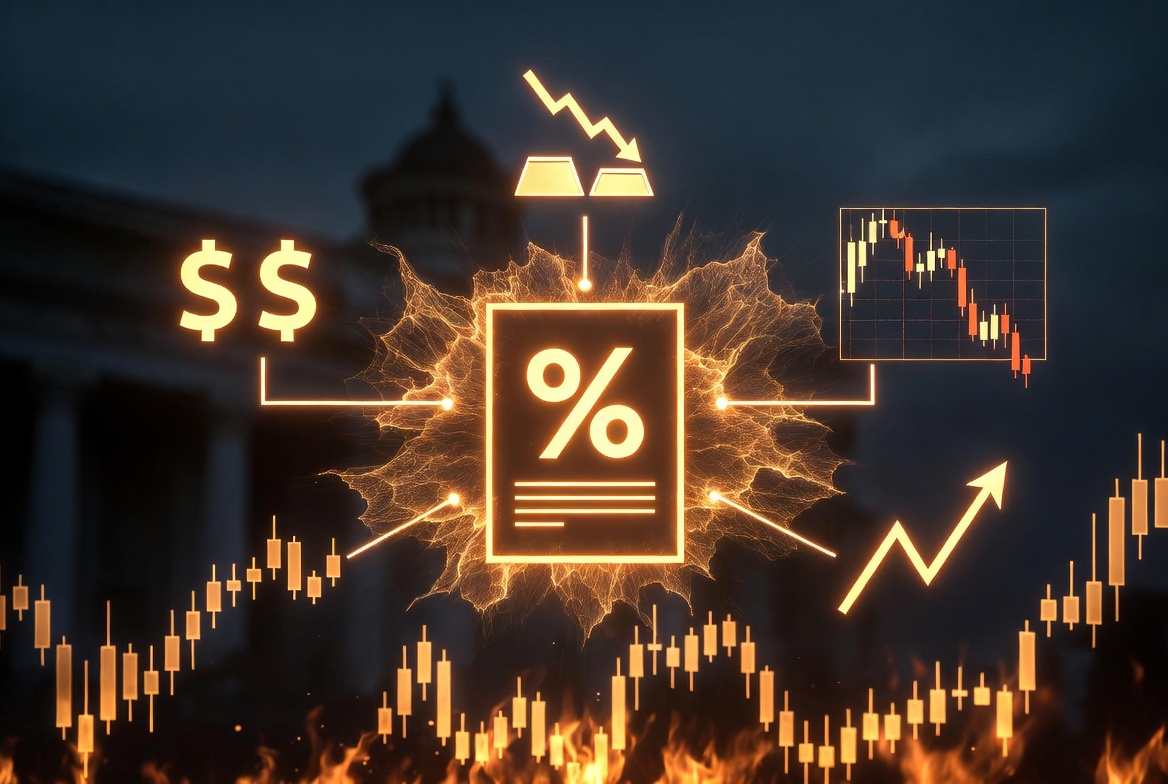
How to Trade CPI: The Macro Trader’s Guide
How to Trade CPI: The Macro Trader’s Guide
Macro Foundations · KenMacro · Evergreen Series · By Ken Chigbo
Macro trader and educator. Founder, KenMacro · Updated April 2026 · 11 minute read
In one sentence
CPI measures inflation — but traders focus on how the reading changes central bank expectations, because that is what moves every market simultaneously.
This guide explains what CPI is and how to trade it in plain terms — from how the number is constructed to how experienced traders position before, during, and after every release.
“CPI does not move markets because inflation is high. It moves markets because expectations were wrong.”
— KenMacro
Contents
What does CPI measure?
Monthly vs annual CPI
Core CPI vs Headline CPI
CPI and the Federal Reserve
Why CPI matters to traders
Why expectations drive markets
How CPI affects forex
How CPI affects gold
How CPI affects stocks
What time is CPI released?
How to read a CPI report
How to trade CPI
CPI trade example
Common mistakes
FAQ
Every month, one number hits the wires and stops the entire financial world. Currency pairs gap. Bond yields spike or plunge. Equity futures reverse. Gold reprices in seconds. The number is the Consumer Price Index — CPI — and understanding it properly separates traders who anticipate those moves from those who react to them after the fact.
Most retail traders know CPI measures inflation. Few understand why a single data point moves forex, gold, and equities simultaneously and in opposite directions. Fewer still have a systematic process for reading the report and positioning around it without gambling on the exact number.
This guide explains what is CPI and how to trade it — from the mechanics of how the index is constructed to a practical process you can apply before every monthly release. By the end you will know what CPI measures, why it moves markets the way it does, how to read the report like a macro trader, and how to approach every CPI release with a clear process rather than a guess. This connects directly to the broader framework covered in the inflation and markets guide — CPI is the instrument that delivers that data every month.
What Is CPI?
CPI stands for the Consumer Price Index. It is the most widely followed measure of inflation in the world, tracking the average change in prices paid by consumers for a representative basket of goods and services over a specified period.
In practical terms, government statistics agencies select a basket of items that typical households buy — food, clothing, housing, transport, healthcare, education, and more — and track how the combined cost of that basket changes from month to month and year to year. The result is expressed as a percentage change. A CPI reading of 3.5% means that basket of goods costs 3.5% more today than it did 12 months ago.
CPI is published monthly in most major economies. The US Bureau of Labor Statistics releases it at 8:30 AM Eastern Time. The Office for National Statistics releases UK CPI at 7:00 AM GMT. These are the two releases with the greatest immediate impact on global markets, given the dollar’s reserve currency status and the pound’s influence on European rates.
Source:US Bureau of Labor Statistics (BLS) — the official publisher of US CPI data.
One line definition: CPI is the speedometer of inflation. It tells you how fast consumer prices are rising — and that speed determines what central banks do next.
What Does CPI Measure? The Basket Explained
The CPI basket is designed to represent the spending habits of a typical urban household. Each category carries a different weight in the overall index, reflecting its share of typical household expenditure. The exact weights vary by country, but the structure is broadly similar across major economies.
US CPI basket — approximate category weightings
| Category | Approx. Weight |
| Shelter (housing, rent) | ~34% |
| Food (at home and away) | ~14% |
| Energy (fuel, utilities) | ~7% |
| Medical care | ~7% |
| Transport (vehicles, fuel, fares) | ~9% |
| Education and communication | ~6% |
| Recreation, apparel, other | ~23% |
Weights are approximate and updated periodically by the BLS. Shelter is the largest single component — which is why housing data matters so much to the inflation picture.
The shelter component deserves special attention. At roughly a third of the total index, it is by far the largest single contributor to CPI. Housing costs are also notoriously slow to respond to interest rate changes — which is why central banks acknowledge a lag between rate hikes and their full impact on CPI. A Fed that raises rates aggressively in year one may not see it fully reflected in shelter CPI until year two or three. This matters for how you interpret any single CPI print.
Monthly CPI vs Annual CPI: What Is the Difference?
Every CPI report contains two readings that measure the same thing over different time horizons. Both matter to traders — but for different reasons.
Year-on-year CPI (annual) compares prices today against the same month 12 months ago. This is the headline figure most quoted in financial media. It tells you the broad inflation trend over a full year and is the primary input for central bank policy decisions. When the Fed talks about getting inflation back to 2%, they are referring to the year-on-year rate.
Month-on-month CPI compares prices against the previous month. This is the more sensitive, forward-looking measure. It picks up changes in inflation momentum faster than the annual figure. A month-on-month reading that is accelerating tells you that annualised inflation is likely to rise in the coming months — before the annual number has fully reflected it.
|
Year-on-year (annual) Measures price change vs 12 months ago Primary policy input. Slower to move. Less sensitive to single-month shocks. Most quoted in headlines. |
Month-on-month Measures price change vs previous month More sensitive. Early signal of trend change. Annualise it (multiply by 12) for a forward-looking inflation rate. |
Practical tip: if month-on-month CPI is re-accelerating even while the annual figure is still declining, that is an early warning that the disinflation trend is stalling — often more market-moving than the headline annual number.
Core CPI vs Headline CPI — Why the Distinction Matters
Every CPI report contains two headline figures that traders watch simultaneously. Understanding the difference between them is non-negotiable.
Headline CPI is the full measure — every category, including food and energy. This is the number most often cited in news coverage. It is the most complete picture of what consumers are actually paying.
Core CPI strips out food and energy. These two categories are excluded because they are heavily influenced by short-term supply-side shocks that have nothing to do with the underlying momentum of inflation. Oil spikes, crop failures, and seasonal food price changes can distort the headline number significantly in any given month.
Central banks focus primarily on core CPI because it reveals whether inflation is persistent. Policymakers cannot raise rates to fix a drought or an oil supply shock — but they can and must respond to broad-based price increases that are becoming embedded in the economy. When core CPI is rising month after month, that signals the kind of structural inflation that warrants sustained tightening.
The trading rule: A hot headline CPI driven entirely by an energy spike tells a different market story than a hot core CPI driven by services inflation. Always check both numbers — and always note which one drove the deviation from consensus.
Why CPI Is Critical to the Federal Reserve
The Federal Reserve has a dual mandate: maximum employment and stable prices. Stable prices means keeping inflation at around 2% over time. CPI is the primary scorecard the Fed uses to measure whether it is meeting that mandate.
When CPI is running significantly above 2%, the Fed faces pressure to raise interest rates to slow the economy and bring prices down. When CPI falls toward or below target, the Fed gains room to cut rates and stimulate growth. Every basis point of CPI surprise directly updates the market’s expectation of where the Fed’s target rate will be in 3, 6, and 12 months’ time.
The Fed does not respond mechanically to any single CPI print. It watches the trend over multiple months, the underlying components, and crucially, its own credibility with financial markets. A central bank whose inflation forecasts have been repeatedly wrong loses the ability to guide expectations — which is why the Fed communicates so carefully about the conditions that would prompt it to act.
For traders, the implication is clear: understanding the Fed’s reaction function matters as much as the CPI number itself. The same CPI reading can produce a different market reaction depending on where the Fed is in its cycle, what it has been communicating to markets, and whether the print confirms or contradicts its stated outlook.
The key question: Does this CPI print force the Fed to change course — or confirm the path it already signalled? The answer to that question determines the magnitude and direction of the market reaction, not the inflation number alone.
Why CPI Matters to Traders
CPI is not just an economic statistic. It is the primary input that drives central bank policy decisions — and central bank policy is the gravity that holds every asset price in place.
When CPI is rising, the central bank faces pressure to raise interest rates to bring inflation under control. Higher rates increase borrowing costs, reduce consumer spending, slow the economy, and eventually pull prices lower. When CPI is falling toward or below target, the central bank gains room to cut rates — stimulating borrowing, spending, and growth.
Every asset class is affected by where rates are and where they are headed. Currencies strengthen when their country’s rates rise relative to others. Bonds fall in price when rates rise. Equities — particularly growth stocks — are valued on discounted future earnings, so higher rates reduce those valuations. Gold competes with yielding assets, so higher real yields reduce its appeal.
One CPI print feeds into all of these simultaneously. That is why it moves every market in the same instant. To trade it effectively, you need to understand the entire transmission chain — which is covered in depth in the inflation and markets guide.
Why Expectations Drive the Market — Not the Number Itself
This is the most important concept in CPI trading, and the one most traders get wrong.
Markets do not react to the CPI number. Markets react to the deviation between the CPI number and what they had already priced in. A CPI reading of 3.5% is bullish for the dollar if the consensus forecast was 3.2%. The same 3.5% reading is bearish for the dollar if the consensus was 3.8%. The number is identical. The market reaction is opposite.
Why? Because by the time the report is published, analysts at every major bank have been surveying economists, running models, and updating their forecasts for weeks. The consensus estimate — available on any financial calendar — is the market’s collective best guess. That guess is already embedded in current prices before the data drops. The market has pre-positioned. What moves prices is the surprise — the gap between expectation and reality.
This is why seasoned macro traders care less about whether inflation is “high” or “low” in absolute terms and more about the direction of the surprise. It is also why the same CPI number in two different months can produce completely opposite market reactions depending on what the consensus was and what the Fed has been signalling.
How CPI Affects Forex Markets
The forex market is the most direct and immediate responder to CPI surprises. The mechanism is straightforward: CPI surprise → rate expectations shift → yield differential changes → currency reprices.
A hotter-than-expected CPI forces the market to price in a more hawkish central bank — either more rate hikes ahead or fewer cuts. Higher rates increase the yield available on that country’s bonds and cash deposits. International investors seeking yield move capital into that country’s assets. Capital inflows strengthen the currency.
The DXY dollar index is the fastest single indicator of how the dollar is reacting to a CPI print. Since the Fed is the most watched central bank in the world and the dollar is the global reserve currency, US CPI has the greatest cross-market impact. A strong DXY move after CPI confirms the rate expectations channel is dominant. Interest rate differentials are the core driver of every major currency pair over medium and long time horizons.
CPI beat vs miss — cross-asset reaction guide
| Asset | Hot CPI (above consensus) | Cool CPI (below consensus) |
| USD / DXY | Strengthens — rate hike expectations rise |
Weakens — rate cut expectations build |
| EUR/USD GBP/USD | Falls — dollar cross moves inversely |
Rises — dollar weakens, pairs rally |
| US 2Y yield | Spikes — fastest repricing of rate expectations |
Falls — cut expectations priced in |
| Gold | Often falls — real yields rise on hike expectations |
Often rises — real yields fall, dollar softens |
| S&P 500 / Nasdaq | Falls — higher discount rate hits valuations |
Rises — rate cut hopes support equities |
| Exception | Hot headline CPI driven by energy alone may not move markets as strongly — watch core CPI and bond yield reaction for confirmation | |
How CPI Affects Gold
Gold’s relationship with CPI is one of the most consistently misunderstood in retail trading. The instinct is to buy gold when inflation is high. Reality is more nuanced — and getting it wrong on CPI day can be expensive.
Gold does not compete with nominal yields. It competes with real yields — nominal interest rates minus inflation expectations. Gold pays no interest or dividend. When real yields are positive and rising, investors can earn a real return by holding bonds instead. Gold becomes less attractive. When real yields are negative or falling, the opportunity cost of holding gold disappears, and capital flows toward it.
This creates a counterintuitive outcome on CPI day. A hotter-than-expected CPI print causes the market to price in more aggressive rate hikes. Nominal yields spike immediately. If those nominal yields rise faster than inflation expectations do, real yields increase — and gold gets sold. The inflation data was hot. Gold fell. Both facts can be simultaneously true.
The reverse is equally true. A cool CPI print causes rate cut expectations to build. Nominal yields fall. Real yields decline. Gold becomes more attractive. The dollar softens, providing a further tailwind since gold is priced in dollars globally.
The rule for gold traders: On CPI day, watch the US 10-year real yield (TIPS yield) and the DXY — not just the headline inflation number. If real yields are rising on the back of the print, gold faces headwinds regardless of how high inflation reads.
Want the full system for reading CPI, rates and cross-asset flows before every major release?
Get the Free KenMacro Framework →
|
Explore the Macro Trading Blueprint →
How CPI Affects Stocks
The equity market does not respond to CPI uniformly. Different sectors move in opposite directions depending on the nature of the inflation surprise — and understanding those differences is where the practical edge lies.
The core mechanism is the discount rate. Every stock’s value is the sum of its future earnings discounted to today. When CPI pushes rates higher, that discount rate increases — and the present value of future cash flows falls. Growth stocks and technology companies are hit hardest because so much of their value lies in earnings many years away. A small increase in the discount rate has a large impact on a company whose earnings are projected a decade out.
Value stocks, energy companies, and commodity producers can actually outperform in high-inflation environments. Energy firms earn more when oil prices are elevated. Banks earn more on the spread between deposit and lending rates in a higher rate environment. Commodity producers see revenues rise with raw material prices. In a hot CPI environment, these sectors tend to hold up or advance while Nasdaq leads the declines.
There is also a second-order dynamic through corporate margins. Inflation raises input costs — wages, raw materials, energy, logistics. Companies that cannot pass those costs to customers through higher prices face margin compression. The earnings impact arrives with a lag — usually two to four quarters after the inflation surge — but it reinforces the initial valuation hit from higher rates.
What Time Is CPI Released?
CPI release times are predictable and published months in advance. There is no excuse for being surprised by a release time. Set calendar reminders for every major release that affects your markets.
Major CPI release schedule
| US CPI (BLS) | 8:30 AM Eastern Time — 2nd or 3rd week of month |
| UK CPI (ONS) | 7:00 AM GMT — typically mid-month Wednesday |
| Eurozone HICP (Eurostat) | 10:00 AM CET — flash estimate end of month, final mid-following month |
| Canada CPI (StatCan) | 8:30 AM Eastern Time — 3rd week of month |
The US CPI release carries the greatest market-moving power given the dollar’s role as the global reserve currency. Always cross-reference with the BLS release calendar for exact dates.
How to Read a CPI Report Like a Macro Trader
Understanding what is CPI and how to trade it properly starts here — with the report itself. Most traders see the headline number and react. Serious traders work through the data in a specific order.
The CPI report contains far more information than the headline number. Knowing where to look and what order to process the data in is what separates informed trading from reactive gambling.
Step 1: Know the three numbers before the report drops
Before every CPI release you need three numbers memorised: the forecast (consensus estimate), the previous reading, and the actual that will arrive. The forecast is available on any economic calendar — Forex Factory, Trading Economics, Bloomberg. Know it. Any trader caught off guard by a CPI release simply failed to prepare.
Step 2: Check both headline and core
When the number hits, check both headline CPI and core CPI immediately. Ask: which one beat or missed? Is the deviation driven by energy prices (less persistent, less policy-relevant) or by services and shelter inflation (more persistent, more policy-relevant)? A beat driven by core services inflation is more significant for rate expectations than a beat driven by petrol prices.
Step 3: Watch the 2-year Treasury yield first
The US 2-year Treasury yield is the fastest real-time signal of how rate expectations are repricing. It moves within seconds of the CPI print and tells you directly what the bond market thinks the Fed will do. A sharp move up in the 2-year yield on a hot CPI confirms rate hike expectations are rising. That confirmation is your first signal for USD direction.
Step 4: Check the DXY
The DXY confirms or contradicts what yields are pricing. If yields spike but the dollar does not follow, something is offsetting the rate-hike signal — possibly risk-off flows, geopolitical noise, or a market that was already very long dollars. Confirmation across both yields and DXY gives you a higher-conviction read.
Step 5: Wait. Then act.
The first 30–60 seconds after a CPI release are the most dangerous time to trade. Algorithmic systems fire in milliseconds, creating violent initial spikes that frequently reverse as the market digests the full picture. The most consistent approach is to wait for the initial move, let the market stabilise, identify the dominant direction, and enter on a confirmation rather than the first candle.
How to Trade CPI: A Beginner Strategy
There is no single “CPI trade” that works every month. Markets, positioning, and central bank contexts change. What remains constant is the process — the steps you follow before, during, and after every release to avoid reactive mistakes and position with context.
CPI trading process — before, during, and after
24 hours before
| ☐ Know the consensus forecast and previous reading |
| ☐ Read recent Fed / BoE / ECB commentary — what are they signalling? |
| ☐ Check CME FedWatch — how many cuts or hikes are priced? |
| ☐ Reduce position size on any existing trades exposed to CPI |
On the release
| ☐ Note headline CPI and core CPI — which beat or missed? |
| ☐ Watch the US 2-year yield — is it spiking or falling? |
| ☐ Watch DXY — does it confirm what yields are doing? |
| ☐ Wait 2–3 minutes for the initial spike to settle |
| ☐ Enter on confirmation — not the first candle |
After the release
| ☐ Check for follow-through Fed speakers — they often comment the same day |
| ☐ Watch for reversal patterns if initial move was too extreme |
| ☐ Log the trade — what happened, why, and what you would change |
CPI Trade Example: How the Sequence Plays Out
A simplified example based on the type of market conditions that characterised the 2022–2023 inflation cycle illustrates how these mechanics work in real time.
Scenario: US CPI prints 3.8% — consensus was 3.5%
|
|||
|
|||
|
|||
|
|||
|
|||
|
Notice that gold fell on a hot inflation print. This surprises most beginners. But the mechanism is clear: rate expectations rose faster than inflation expectations, real yields increased, and gold followed them lower.
Common Mistakes Traders Make on CPI Day
Six mistakes that cost traders money on CPI day
|
1. Trading the absolute number, not the deviation A CPI of 4% is meaningless without knowing the consensus. Always check the deviation first. |
|
2. Ignoring core CPI Headline CPI can be distorted by energy spikes. Core CPI reveals persistent inflation. Central banks respond to core — so should you. |
|
3. Buying gold on hot CPI automatically Hot CPI triggers rate hike expectations which raise real yields — the primary headwind for gold. Watch real yields, not just the headline print. |
|
4. Entering on the first candle The first 30–60 seconds produce whipsaw moves that frequently reverse. Wait for confirmation before committing size. |
|
5. Not watching yields and DXY alongside price Cross-market confirmation — yields moving with DXY, both confirming your trade direction — dramatically increases conviction and reduces false entries. |
|
6. Forgetting the central bank context CPI means different things at different points in the cycle. Hot CPI when the Fed is already hiking causes a different reaction than hot CPI when they are nearly done. Context determines magnitude. |
Final Takeaway: CPI Is a Signal, Not a Trade
Every month, traders rush to react to the CPI number without understanding what they are actually reacting to. The number itself has no inherent meaning — it is the deviation from expectations, the central bank’s likely response, the movement in real yields, and the confirmation across yields and DXY that together tell you what the trade is.
The traders who consistently profit from CPI releases are not the ones who guess the number correctly. They are the ones who understand the transmission chain from inflation data to central bank expectations to rate moves to capital flows to asset prices — and who have prepared a clear process before the number ever drops.
Knowing what is CPI and how to trade it is not just about the monthly number — it is about embedding this framework into every release cycle. CPI is one node in a larger macro framework. It feeds into central bank decisions, which drive interest rate differentials, which move capital flows, which ultimately determine every price on your chart. Understand the full chain and CPI day becomes one of your most powerful trading opportunities rather than one of your most dangerous.
Most traders ask “was CPI hot or cool?” The right question is: “what does this deviation tell us about what the central bank will do — and what does that mean for every asset class simultaneously?”
Continue learning — related KenMacro guides
Stop reacting to CPI. Start reading it.
The KenMacro Framework gives you the complete cross-asset system — how CPI connects to central bank policy, real yields, capital flows, and every market simultaneously.
About the author
Ken Chigbo
Founder, KenMacro
Macro trader and educator helping serious traders understand what actually moves markets — before the headlines hit. Covering inflation, interest rates, central bank policy, and the forces that drive capital flows globally. kenmacro.com
Frequently Asked Questions: CPI Trading
What is CPI?
CPI is the Consumer Price Index — the most widely followed measure of inflation. It tracks the average price change of a basket of goods and services purchased by households. Published monthly, it is expressed as a year-on-year percentage. A CPI of 3.2% means consumer prices are 3.2% higher than 12 months ago.
How do traders trade CPI?
Traders position around the deviation between the actual print and the consensus forecast. Preparation involves knowing the forecast, checking central bank language, and identifying key yield and DXY levels. On the release, traders watch the 2-year yield and DXY for confirmation before entering — not the first volatile candle.
Why does CPI move forex?
CPI moves forex through the central bank expectations channel. A hot CPI forces markets to price in more rate hikes, which raises that currency’s yield advantage, attracts capital inflows, and strengthens the currency. The mechanism runs through policy expectations — not through inflation directly affecting exchange rates.
Does CPI affect gold?
Yes — but not as most beginners expect. Gold responds to real yields. When a hot CPI triggers aggressive rate hike expectations, nominal yields rise sharply, real yields increase, and gold typically falls despite high inflation. Watch real yields and the DXY, not just the headline number.
What is Core CPI?
Core CPI excludes food and energy prices — the most volatile components. Central banks focus on core CPI because it reveals persistent inflation trends. A hot headline CPI driven by an energy spike tells a different policy story than persistently rising core services inflation.
What time is CPI released?
US CPI is released at 8:30 AM Eastern Time by the Bureau of Labor Statistics, typically in the second or third week of each month. UK CPI is released at 7:00 AM GMT. Exact dates are published in advance on the BLS calendar and all major economic calendars.
External references: US Bureau of Labor Statistics — CPI · CME FedWatch Tool · Federal Reserve · UK ONS — Inflation. This is macro education and does not constitute financial advice.
The desk's vetted partner stack
Trade with the brokers KenMacro has audited and uses live.
Blueberry · FREE Macro Desk bundled
Star Trader · $50 + 1:1000 leverage
E8 Markets · Code KENMACRO for 5% off
Or join the desk on Discord (Free) →
Affiliate disclosure: KenMacro earns a commission on broker sign-ups via these links at no extra cost to you. Capital at risk on all CFD trading.
Related institutional reading from the desk
The desk's deepest pieces on the macro framework, broker selection, and prop firm economics for serious traders.
- Best Forex Broker for Day Trading 2026, KenMacro Top 3 Verdict
- Best Forex Broker for Macro Trading 2026
- Best Forex Broker for Emerging Markets 2026, Star Trader vs Exness
- Best Prop Firm for Macro Traders 2026
- How Much Do Prop Firm Traders Actually Make in 2026
- How to Trade Gold (XAUUSD), the Macro Trader's Institutional Guide
- How to Trade NFP, the Macro Trader's Guide
- Vantage vs Blueberry vs Star Trader 2026, Three-Way Verdict
For the live framework that runs every London open, the desk's macro intelligence layer at KenMacro publishes daily. Free Discord access and full archive at kenmacro.com.
Brokers (audited by KenMacro)
Blueberry Markets FREE Macro Desk bundled
Star Trader $50 + 1:1000 leverage
E8 Markets Code KENMACRO for 5% off
KenMacro earns a commission on broker sign-ups via these links at no extra cost. Capital at risk on all trading.
The MACRO MASTERY desk
The full institutional macro desk, delivered through Discord.
- Live trade ideas with full ladders
- Macro-Flow scanner on Tier A assets
- Weekly scorecard + Sunday Brief PDF
- Daily pulses (London / NY / Asia)