
Why Is Nasdaq Falling Despite Nvidia’s Record Earnings? The AI Sell-Off, Treasury Yields and My Short Scenario
Why would I be looking for shorts when everyone was getting excited about artificial intelligence again? Because the market isn’t simply trading Nvidia’s earnings. It’s trading the environment those earnings are being generated in, and that environment looks very different.
This is something I’ve been discussing for weeks, and I explained the framework behind it in a full video eleven days ago.
Published on my YouTube channel on 8 November 2026, 25 minutes. I walk through why apparently positive economic news can create problems for equities, how interest rate expectations feed into valuations and why you need to read the bond market before you read the Nasdaq chart. It didn’t predict today’s exact move; it explains the mechanism behind it.
The market in 60 seconds
- Nvidia reported third-quarter fiscal 2027 revenue of $115.8 billion on 17 November, up 103% year on year and 20% on the previous quarter.
- Anthropic priced its IPO at $83 and first traded at $111.50 on 19 November, about 34% higher, before closing at $97.17.
- Nasdaq-100 futures rose more than 2% early on Thursday. The Composite was up as much as 2% in the session, then closed down 2.25% at 23,879.20.
- The S&P 500 fell 2.02%, its sixth straight loss, and the Dow lost 1,101 points.
- The official 10-year Treasury yield was 5.07% on 18 November and 5.04% on 19 November. The 2-year was 4.80% and then 4.76%.
- The Fed minutes published on 18 November said almost all participants judged further rate increases would likely be appropriate.
- The next big US inflation test is PCE on Wednesday 25 November at 13:30 UK.
The takeaway? The AI growth story hasn’t disappeared. But the price investors are willing to pay for that growth is changing.
Nvidia doubled its revenue. Why wasn’t that enough?
| Measure | Reading |
|---|---|
| Quarterly revenue | $115.8 billion |
| Growth year on year | 103% |
| Growth on the previous quarter | 20% |
| GAAP net income | $65.3 billion |
| Reported | 17 November 2026, after the US close |
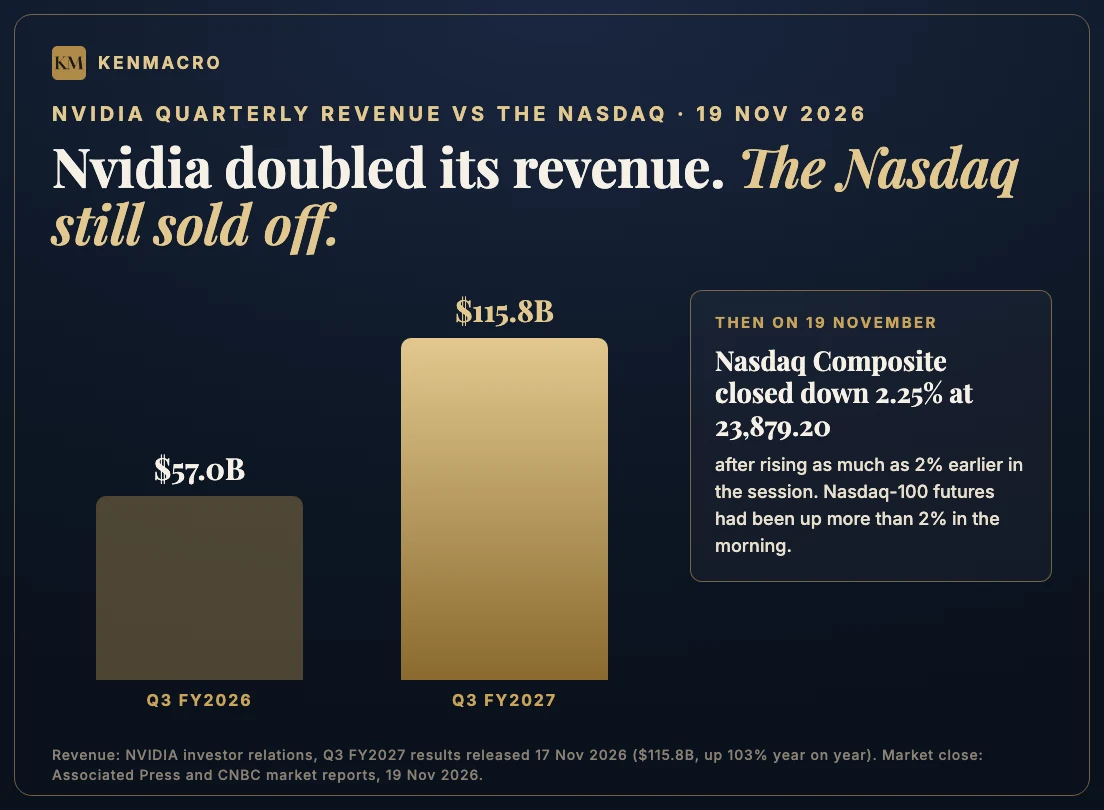
These are extraordinary numbers, and there’s no question about that. But when you evaluate Nvidia, or the wider technology sector, you need to separate two things: the performance of the business, and the price investors are prepared to pay for that performance. A company can keep generating exceptional revenue while its share price falls. If the market has already priced in enormous future growth, even excellent results may not justify materially higher valuations.
Then you add a tougher interest rate environment, and the conversation changes. The question isn’t simply whether Nvidia is making more money. It’s whether the future profits investors expect are enough to justify today’s valuation, given the returns available elsewhere and the risks involved.
Anthropic’s IPO couldn’t hold the wider tech rally
Anthropic’s debut adds another layer to today’s session. The shares were priced at $83, above the marketed range, and first traded at $111.50, which tells you there’s still serious appetite for AI exposure. Yet that enthusiasm didn’t carry the wider market, and Anthropic itself closed at $97.17, well off its opening print.
That distinction matters. Demand for one AI company doesn’t mean investors are comfortable with every valuation across the sector. You can have huge long-term enthusiasm for artificial intelligence and a significant correction in AI-related stocks at the same time. Those two things aren’t mutually exclusive, and personally I think that’s one of the biggest misunderstandings in this market right now. Being cautious on the Nasdaq doesn’t mean you think AI is worthless. It means you’re questioning the price, the positioning and the macro conditions around the investment.
Why 5% Treasury yields matter so much for technology stocks
| Maturity | 18 Nov | 19 Nov |
|---|---|---|
| 2-year | 4.80% | 4.76% |
| 5-year | 4.89% | 4.86% |
| 10-year | 5.07% | 5.04% |
| 30-year | 5.41% | 5.40% |
Notice something. Yields actually edged lower on Thursday, and the Nasdaq still fell. That’s an important detail, because it shows today’s move wasn’t a simple reaction to one tick in the bond market. What matters is the level. If investors can earn around 5% on longer-dated US government debt, what return do they need to justify taking far more risk in an expensive technology company? The higher that required return, the harder it is to justify stretched valuations.
There’s a simple mechanism behind this. The value of a business today depends partly on the present value of the cash it’s expected to generate in the future, and as the discount rate rises, that present value falls, all else equal. For illustration, $100 received ten years from now is worth about $67.56 today at a 4% discount rate. At 5%, it’s worth about $61.39. Nothing changed about the future $100. What changed is what investors will pay for it today.
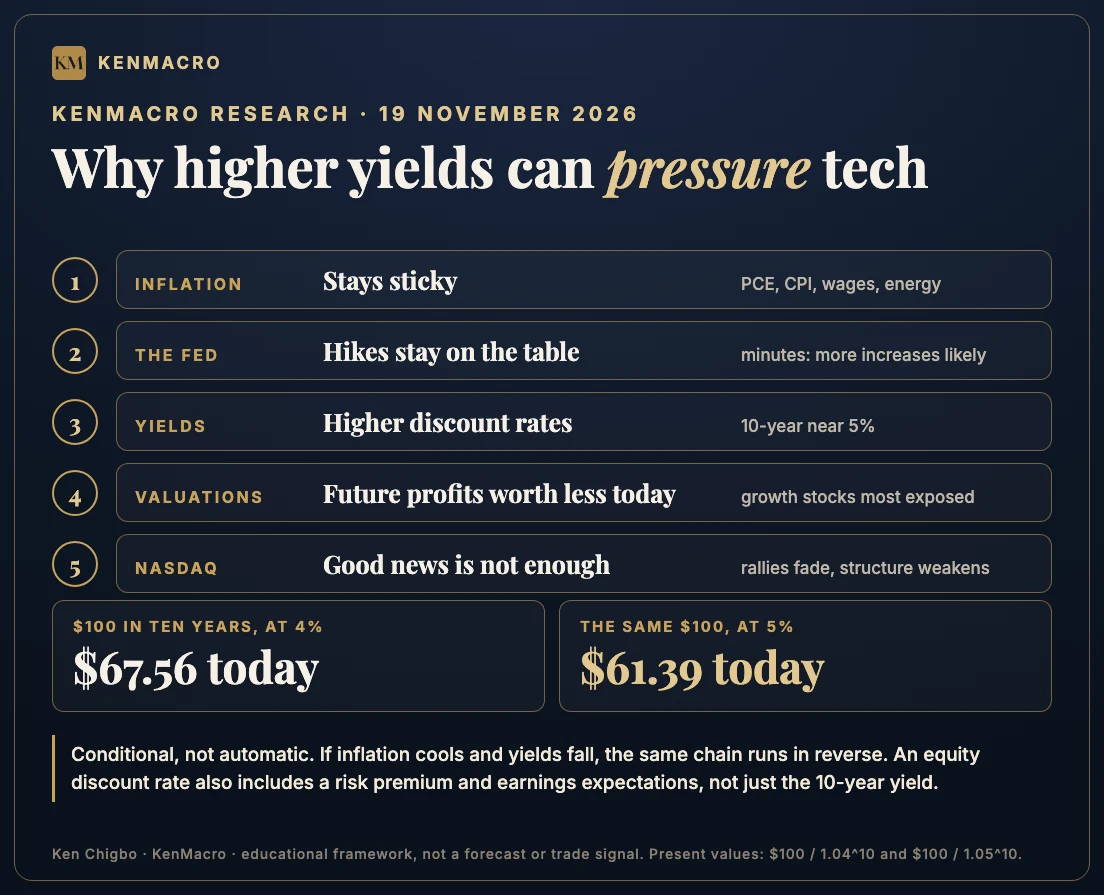
Of course, an equity discount rate isn’t just the 10-year Treasury yield. Investors also price an equity risk premium, company-specific risks and changing earnings expectations. But the principle holds: the cost of capital changes the price of growth. That’s why I spend so much time on the bond market before I even look at what the Nasdaq chart is telling me.
The Federal Reserve is the other problem for the Nasdaq
On Wednesday the Fed published the minutes of its 27 and 28 October meeting. The key line: “almost all participants judged that, under their baseline outlooks for inflation and the labor market, further action to raise the target range for the federal funds rate … would likely be appropriate.” Two members had already dissented in favour of a hike at that meeting. You can read the official minutes here.
The Fed has to weigh inflation, consumer spending, jobs, wages, energy prices and financial conditions, and recent US data has kept showing underlying resilience alongside sticky inflation. That’s a difficult backdrop if you’re expecting easier policy any time soon. A strong economy is generally good for revenues, but if that strength lets the Fed stay restrictive, the valuation effect works the other way. That’s why good economic news can sometimes mean falling stock prices. The market isn’t necessarily saying the economy is weak. It may be saying the rate relief investors hoped for isn’t coming as quickly as they expected, and when big parts of the market are priced for strong growth, that matters enormously.
We’ve been discussing these risks since October
Today’s reversal isn’t something I’m suddenly trying to explain after watching the market fall. There’s a dated public record of the framework, and here it is, linked to the original pieces so you can check what was said and when.
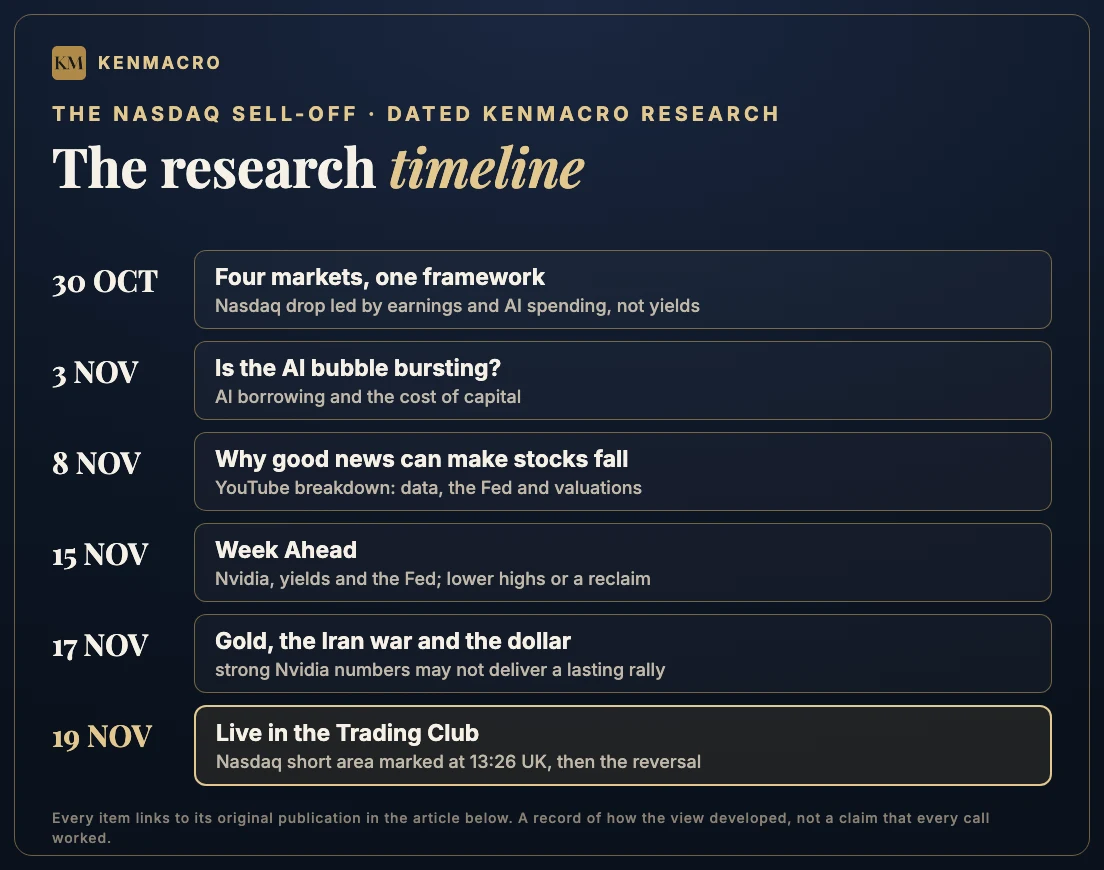
- 30 October 2026. In four markets, one trading framework I wrote that the Nasdaq’s drop was led by earnings and AI spending, not bond yields. Yields weren’t the immediate driver of every sell-off, and I said so.
- 3 November 2026. Is the AI bubble bursting? looked at the Nasdaq-100 correction, the borrowing behind the AI build-out and why the cost of financing deserved far more attention. The point wasn’t that AI was about to disappear. It was that an investment boom this size becomes sensitive to the cost of money.
- 8 November 2026. My YouTube breakdown, Why GOOD News Can Make Stocks FALL, explained the link between strong data, rate expectations and tech valuations.
- 15 November 2026. Sunday’s Week Ahead put Nvidia earnings, Treasury yields and the Fed at the centre of the week, and said that if the Nasdaq kept rejecting recovery attempts and printing lower highs and lower lows, the bearish technical argument would strengthen. (The Week Ahead page is updated every Sunday.)
- 17 November 2026. In why gold is falling despite the Iran war I wrote that strong Nvidia numbers might not deliver a lasting rally if investors were worried about rates, and described two Nasdaq scenarios: a retest of the upper range for shorts, or a break of the range, a retest and continuation.
- 19 November 2026. Live in the Club, the short area and the conditions, before the reversal. That’s the next section.
Not every view along the way was right, and earlier in the autumn I was bullish on the Nasdaq into its record highs. The point of the record is the process: the macro picture changed, and the analysis changed with it.
My Nasdaq short scenario: what we were watching live
One of the biggest mistakes I see traders make is deciding to short something simply because they think it’s expensive. That isn’t my approach. I can hold a bearish macro view for days without taking a single short. The macro gives me the context, the technical structure tells me whether price agrees, and my execution criteria decide whether there’s actually a trade.
Here’s how today’s session went, using the recording’s timestamps (UK time):
- 13:09. Early in the session I said I still thought the Nasdaq would come off at some point, and that gold rallies were likely to be sold too.
- 13:23 to 13:26. On the one-hour chart the Nasdaq had pushed up into the mid-27,000 region. I explained that the daily structure was still bearish, with lower highs and lower lows, and that I was looking at this area as a potential short zone. My words to members: “I want to see a nice bearish rejection out from this region here and then I’ll be looking to take those shorts.” If price pushed through, I would leave it.
- 13:48. I showed members the equal highs on the Nasdaq and the same structure on gold, a step ahead, and linked it to rising yields and inflation fears.
- 13:55. I told members I would wait, because price could still form a head and shoulders or grab the liquidity above the highs before selling.
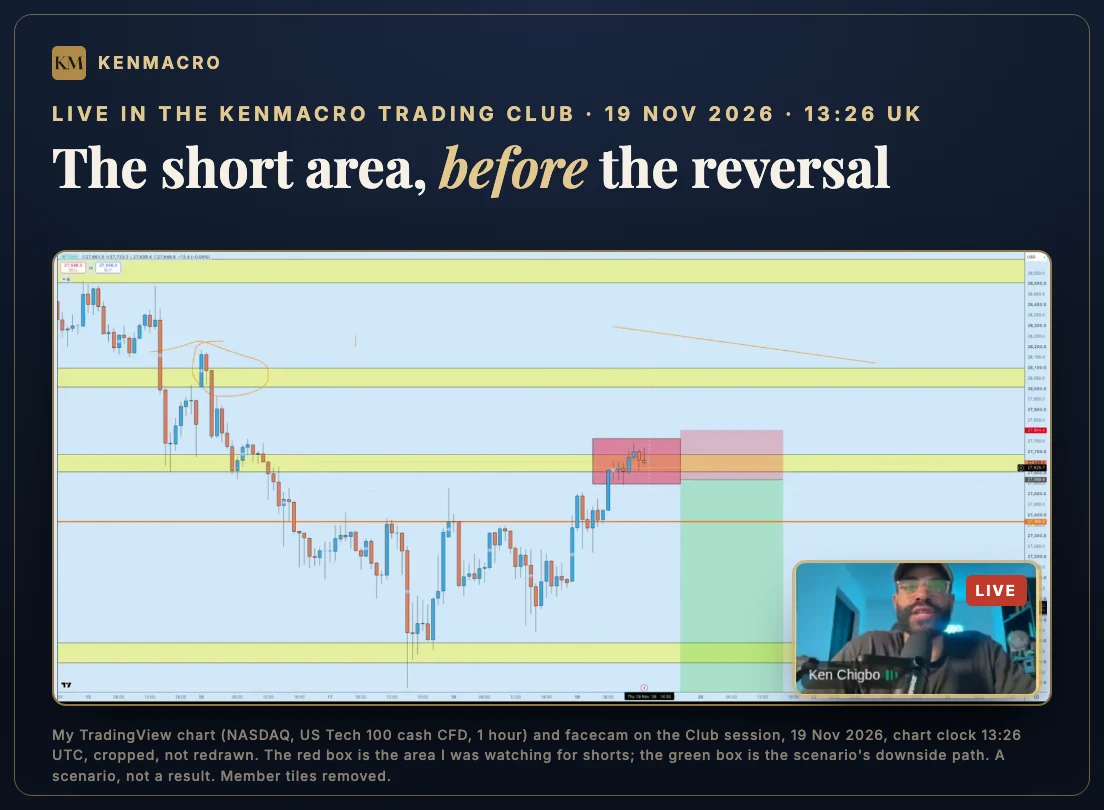
What I want members to understand is the sequence. First the macro framework, then the wider market environment, then the technical areas worth monitoring, and then you wait for price to give you a reason. If those conditions aren’t there, we don’t manufacture a trade. If the market invalidates the idea, we reassess.
The market then reversed. After the US open the rally failed and the breakdown came, and that’s when I took the short on USTEC, my broker’s US Tech 100 CFD. I sold at 27,188.10 and closed that position at 26,625.10, about 563 points lower. A second short opened at 27,197.70 was still running when I shared the screenshots at 19:03 UK, with the stop moved to 27,100. Those are my own positions, not a member’s result, and past results don’t guarantee future ones.
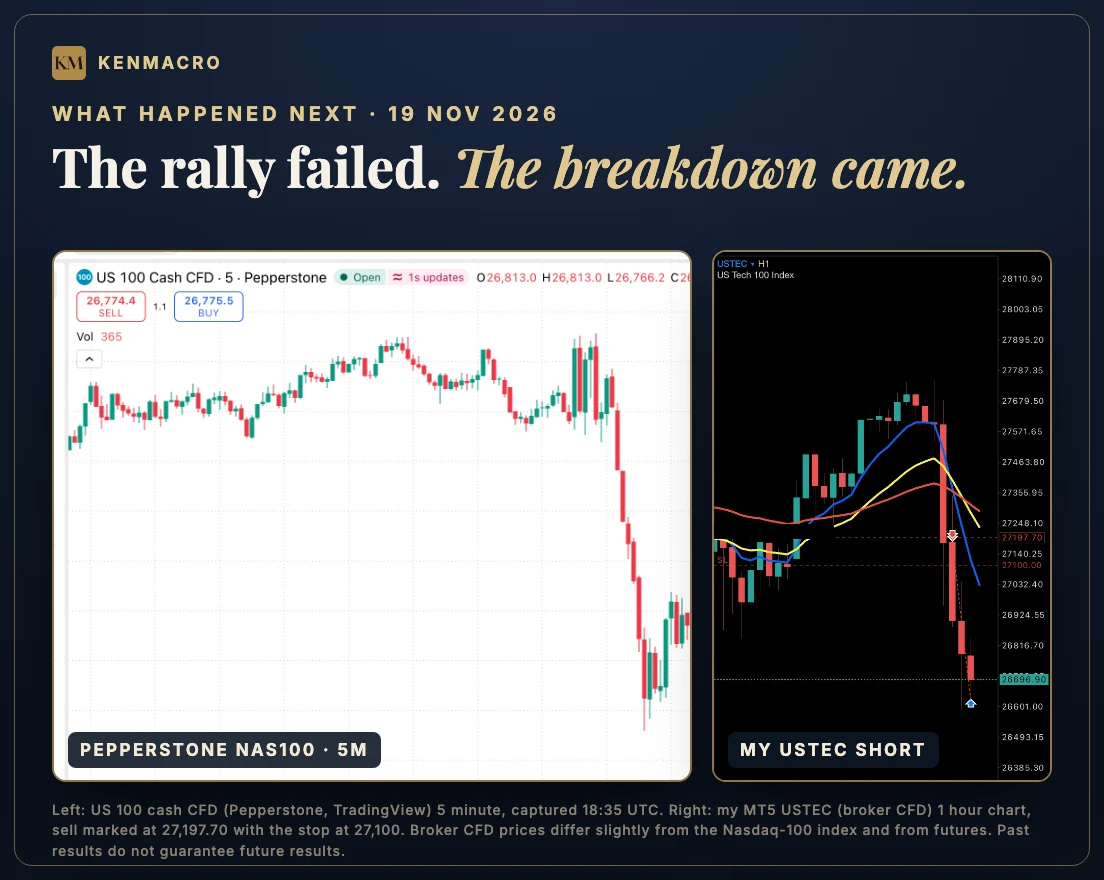
That’s the difference between having a process and chasing the market.
Is the AI bubble bursting?
I think traders need to be careful with the word bubble. It’s easy to look at falling tech stocks and conclude the whole AI investment cycle is collapsing, but there’s a difference between a structural collapse, a valuation correction and a market repricing the cost of future growth. I’m watching whether earnings and margins keep improving, whether companies are earning a decent return on their AI spending, whether financing conditions are tightening and whether investors are demanding more credit risk premium. And I’m watching whether tech keeps underperforming even when companies report strong numbers.
That last one is especially relevant today. When positive news repeatedly fails to produce a sustained rally, I pay attention. It doesn’t mean prices must keep falling, but it suggests investors are reassessing how much optimism was already in the price. The full debt and financing argument is in my earlier research on AI borrowing, the Nasdaq and bond yields.
What could cause the Nasdaq to fall further?
I’m watching three conditions. The first is another meaningful rise in Treasury yields, which would tighten financial conditions and put more pressure on tech valuations. The second is a fresh inflation surprise that forces the market to rethink the Fed’s path. The third is continued technical deterioration, especially if recovery attempts are rejected and the market keeps making lower highs and lower lows. Put those together and the case for further selling gets stronger.
But I don’t want to chase an extended move. Bearish markets can produce extremely aggressive relief rallies, which is why I want price to pull back into relevant areas and show me whether sellers are still in control.
Could the Nasdaq stage a major recovery?
Absolutely. Being bearish on the current structure doesn’t mean ignoring a changing environment. If inflation cools, yields retreat and investors worry less about more tightening, the valuation pressure on tech could ease a lot, and after this much selling that could mean a powerful relief rally. The question then is whether it’s a short squeeze or a real change in structure, and I’d want to see buyers reclaim important levels and hold them. My view has to adapt when the evidence changes, and that’s something I stress in every session.
Wednesday 25 November: the next test for the Nasdaq, gold and the dollar
The next catalyst I’m focused on is US PCE inflation. On Wednesday 25 November at 13:30 UK (08:30 Eastern), the Bureau of Economic Analysis is scheduled to release October personal income and outlays, which includes the PCE price indexes, alongside its second estimate of third-quarter GDP. Here’s the official BEA release schedule. PCE matters because it’s the inflation measure the Fed uses for its 2% objective. The reaction will depend on how the data compares with expectations and what it means for the path of rates.
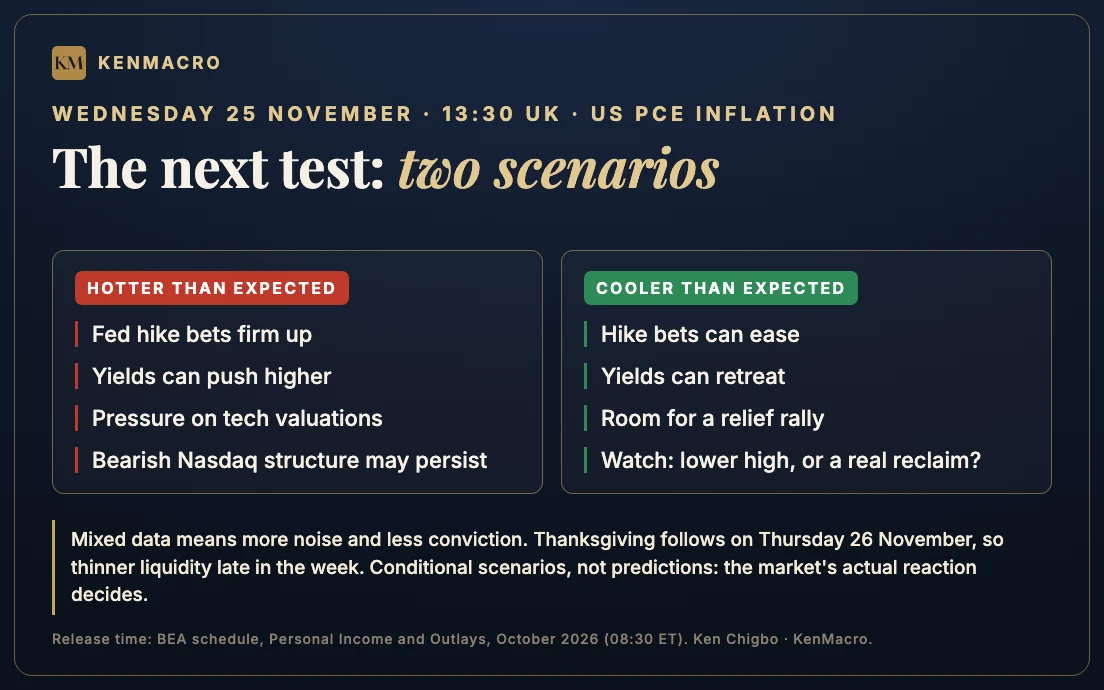
| Scenario | Potential implications |
|---|---|
| Inflation beats expectations and yields rise | More pressure on tech valuations; the bearish Nasdaq structure may persist |
| Inflation cools and yields retreat | Room for a relief rally in tech stocks and gold |
| Mixed inflation and growth data | More uncertainty, sharper intraday swings, less conviction |
| Tech rallies but yields stay high | Watch whether the bounce holds or becomes another lower high |
These are conditional scenarios, not fixed predictions, and the market’s actual reaction matters more than what I think it should be. Thanksgiving follows on Thursday 26 November, so liquidity late in the week deserves attention too. I’d be careful assuming a big move in thin holiday trading is the start of a sustainable new trend.
What I’m watching next
For the Nasdaq my focus stays on the relationship between the macro environment and the technical structure: what Treasury yields are doing, whether the dollar keeps strengthening, whether rate expectations are getting more or less restrictive, and whether the Nasdaq can build a real recovery or keeps rejecting higher prices. You can follow the wider picture on my Macro Regime Board, my US Dollar Index outlook and my gold price analysis, and for the geopolitical side, my earlier outlook on Iran talks, oil and payrolls. These markets are connected, and understanding the connections gives you a much clearer picture of what you’re trading in.
Final thoughts
Nvidia can report extraordinary earnings. Anthropic can have a historic debut. The AI industry can keep expanding. And the Nasdaq can still fall. There’s no contradiction once you understand that markets are constantly repricing expectations, valuations and the cost of capital. The headline is only the beginning.
For me, today reinforces why I approach these markets through both macroeconomics and technical analysis. I don’t want to discover the reason for a move after it’s happened. I want to understand the conditions that could create it, identify the areas that matter and know what would change my view. That’s what we’ve been doing throughout this sell-off, and it’s what we’ll keep doing into Wednesday’s inflation data.
I’ll see you inside.
Ken Chigbo
Transcript of today’s Nasdaq reel (19 November 2026)
Nasdaq futures were up nearly 2% today, Nvidia’s just doubled its revenue, and Anthropic’s gone public in the biggest IPO in history, and now the market’s selling off. But earlier inside my Trading Club, we were looking for shorts.
[Live in the Club] “I want to see a nice bearish rejection out from this region here, and then I’ll be looking to take those shorts.”
Now, why would I be looking to short the Nasdaq when everybody’s getting excited about AI again? Because I don’t just trade headlines. US 10-year yields are hovering around 5%. The markets are expecting the Fed to hike rates again in December, and investors are questioning how much they’re willing to pay for these tech companies.
[Live in the Club] “With yields rising, this obviously takes a toll on stocks. See the exact same price action, but it’s obviously a little bit of a step ahead.”
So we’ve had our area of interest mapped out. We waited for the market to show its hand.
[Live in the Club] “Evening star here, potentially going to be validated with bearish engulfing in the four hours. This price action here looked a bit suspect for a continuation to the downside.”
So yeah, the price action is looking really nice. But here is what could really shake up these markets next Wednesday: inflation. If it comes in hot, this sell-off could go further. If it cools, don’t be surprised by a potential violent short squeeze.
This is what we’re doing live inside my KenMacro Trading Club. Understanding the macro, reading the charts, adapting as markets change. If you want to learn this yourself, comment CLUB and I’ll send you the details.
Machine transcript of the published reel, lightly corrected for spelling. The reel was recorded on 19 November before the US close; figures in it are as spoken at the time, and the article above gives the verified closing data.
Frequently asked questions
Why is the Nasdaq falling despite strong Nvidia earnings?
Strong earnings don’t automatically support higher share prices. Treasury yields above 5%, expectations of tighter Fed policy, high valuations and growth that was already priced in can outweigh good company results. On 19 November 2026 the Nasdaq Composite reversed an early gain of as much as 2% to close down 2.25%.
Why do higher Treasury yields hurt technology stocks?
Higher yields raise the return investors require from riskier assets and lift the discount rates used to value future earnings. Growth stocks, whose valuations depend heavily on profits far in the future, tend to feel that most. For example, $100 due in ten years is worth about $67.56 today at 4% but about $61.39 at 5%.
Is Nvidia profitable even though its share price is falling?
Yes. Nvidia reported third-quarter fiscal 2027 revenue of $115.8 billion, up 103% year on year, and GAAP net income of $65.3 billion. Share price weakness doesn’t mean the underlying business has stopped growing.
Is the AI bubble bursting in November 2026?
Technology stocks face real valuation and financing concerns, but falling prices alone don’t prove the AI growth cycle has collapsed. Earnings, capital spending, financing conditions and investor expectations all need to be weighed, and a valuation correction is not the same as a structural collapse.
Can good economic news make the Nasdaq fall?
Yes. Strong data can raise expectations of higher interest rates when inflation is still elevated, and higher expected rates and yields can pressure equity valuations even when the economic news itself is positive.
When is the next US PCE inflation report?
October 2026 personal income and outlays, including the PCE price indexes, is scheduled for Wednesday 25 November 2026 at 08:30 Eastern Time, 13:30 UK, according to the BEA release schedule, alongside the second estimate of third-quarter GDP.
How do I learn to combine macroeconomics and technical analysis?
Start with the economic environment, work out how it affects each asset, then use technical market structure to build conditional scenarios and clear execution criteria. KenMacro Trading Club teaches this approach with live market sessions, recordings and structured courses.
About the author: Ken Chigbo is a macro trader, educator and founder of KenMacro, with 18 years of financial markets experience and a background in City of London financial markets analysis.
The macro interpretations and conditional scenarios in this article are my own. This article is for educational and informational purposes only and does not constitute personalised investment advice. Trading involves risk, and past performance does not guarantee future results.
Get the macro framework the desk actually trades
The same regime-first framework behind every call on this site. Free. No spam, unsubscribe anytime.
Continue reading
From the desk
Where this gets traded
CPI and FOMC are the moments a weak broker is exposed, spreads gap and fills slip. See the KenMacro desk guide to the best brokers for trading the print.
Read the desk guide →