
Trump Is Talking Peace. Iran Is Still Fighting. And the US Jobs Report Just Complicated Everything.
The situation in 60 seconds
- US politics. Democrats won control of the House and the Senate in Tuesday’s midterms, according to network and AP projections, with a handful of races still being counted.
- Iran diplomacy. Trump and Qatar’s Emir, Sheikh Tamim bin Hamad Al Thani, spoke on Friday about de-escalation. Talks are active through Qatar, but no final deal has been confirmed.
- Oil. WTI fell from $104.12 to about $90.83, down 12.8% on the week. Like-for-like, January Brent fell about 13.3% to $98.32.
- US jobs. October payrolls rose 165,000, unemployment fell to 4.1% and average hourly earnings rose 0.4% on the month.
- Central banks. The Fed held at 3.75% to 4.00% on 28 October with two officials voting to hike. The Bank of England raised Bank Rate to 4% on Thursday.
- Stocks and gold. The Nasdaq 100 fell 6.36% on Thursday. Gold is still heading for its best week since late August despite slipping after the jobs data.
My central view is that markets are trying to price a new macro environment before there’s enough evidence that it’s actually arrived. That’s why the next few sessions matter so much, and why I’d rather understand the moving parts than pick a side and hope.
Trump, Qatar and Iran: progress on diplomacy, but no agreement
Let’s start with the development I think deserves the most attention. On Friday, President Trump held a phone call with Qatar’s Emir. According to the Emir’s office, as reported by Anadolu Agency, the two leaders discussed Qatar’s mediation to narrow the differences between Washington and Tehran and reach “a comprehensive agreement that resolves the crisis”, with the Emir stressing freedom of navigation through the Strait of Hormuz and the security of energy supplies. A US official confirmed the call took place, but I haven’t seen a White House readout, so that wording is Qatar’s.
That’s still significant, because Qatar is the central channel between the two sides. A Qatari delegation was in Tehran on Monday for talks that ran over three hours, and on Tuesday the foreign ministry spokesman, Majed al-Ansari, said both sides were reviewing proposals but that “bridging the gap is still a work in progress”. So the diplomacy is real. But talking about peace is not the same as reaching an agreement, and the issues that matter most, Iran’s nuclear programme, sanctions relief, frozen assets and shipping through Hormuz, are still open.
The military picture hasn’t gone quiet either. Iran’s Revolutionary Guard says it shot down a US MQ-1 drone over Qeshm Island on Friday, which it describes as the sixteenth over the island. That’s an IRGC claim and I haven’t seen it confirmed or denied by the US. Earlier in the week the US reportedly struck an Iranian air-defence site on the same island, and tanker attacks in the Gulf have continued at a high pace, enough to lift Brent about 4% on Thursday even in the middle of this sell-off.
Then there’s Russia. The Financial Times and the Guardian have reported leaked Russian defence-industry documents showing an agreement to supply 90 helicopter-mounted launchers for precision-guided missiles to a buyer identified in other records as Iran, with deliveries scheduled for late 2024 to December 2025. But the documents don’t establish that anything was delivered, and Moscow denies arming Iran for this war.
None of this proves a wider war is coming, and none of it proves the talks will fail. It tells you there’s real military risk running alongside the diplomacy, and that’s an uncomfortable place for markets to be.
Why oil has fallen so aggressively
To understand the oil market right now, you’ve got to understand what traders have been paying for. For most of this year crude has carried a large geopolitical risk premium, the extra amount buyers pay because they’re worried about future supply disruption. Tankers face more risk, insurance gets more expensive, cargoes take longer routes and any disruption to the Strait of Hormuz threatens one of the world’s most important energy corridors. You don’t need a physical shortage today for prices to rise. The possibility of one tomorrow can be enough.
The reverse is also true. Once traders believe the risk of escalation is falling, they start stripping that premium out, and that’s what happened this week.
After Tuesday’s midterms the market priced a greater chance that Trump would look for a diplomatic exit rather than a longer war. On Wednesday alone WTI fell 8.3% to settle at $88.12 and Brent fell 8.7% to $94.62, their lowest settles since 31 August. Reuters described Brent as set for its steepest weekly percentage fall since the pandemic began, although that comparison runs across a futures contract roll. On a like-for-like contract the move was about 13%, which is still enormous.
This isn’t an inventory story. It’s a repricing of geopolitical probabilities, future supply and inflation expectations.
But here’s my concern: markets can remove a war premium much faster than the underlying risk actually disappears. Even with an agreement, damaged infrastructure, restricted shipping and disrupted trade flows don’t snap back to normal overnight, and if talks break down that premium can come back just as quickly. As I set out in Oil Is Crashing. Democrats Have Won Congress. Is the Inflation Trade Finally Turning?, a headline can create the move, but the price structure tells you whether it’s becoming a trend.
The Democrats have won Congress. What actually changes?
This is another area where I think traders need to be careful. Winning both chambers is a significant political development, but it doesn’t make Trump’s policies disappear overnight. The new Congress doesn’t sit until 3 January 2027, Trump remains president and commander-in-chief, and large parts of trade and military policy run on executive authority that doesn’t vanish because the opposition wins an election.
What changes immediately is the political calculation. A Democratic Congress makes new spending packages and parts of the fiscal agenda much harder to pass, and it raises the scrutiny and pressure over the war. If markets expect less fiscal stimulus and less extra borrowing, they start revising their expectations for inflation and bond issuance. But don’t assume a Democratic win guarantees lower inflation. The actual legislation matters, oil matters, tariffs matter and the labour market matters, and the Fed responds to the economy, not to which party runs Congress.
There was also a market consequence that got far less attention on Tuesday night. Thursday’s rout, with the Nasdaq 100 down 6.36% and the S&P 500 down 4.36%, was reportedly driven by fears that the election results will slow the AI data-centre build-out. That’s a reminder that the same political event can be disinflationary for oil and bearish for tech at the same time. I covered the debt and valuation side of that story in Is the AI Bubble Bursting? Nasdaq, Debt and Bond Yields Explained.
Friday’s jobs report just complicated the disinflation story
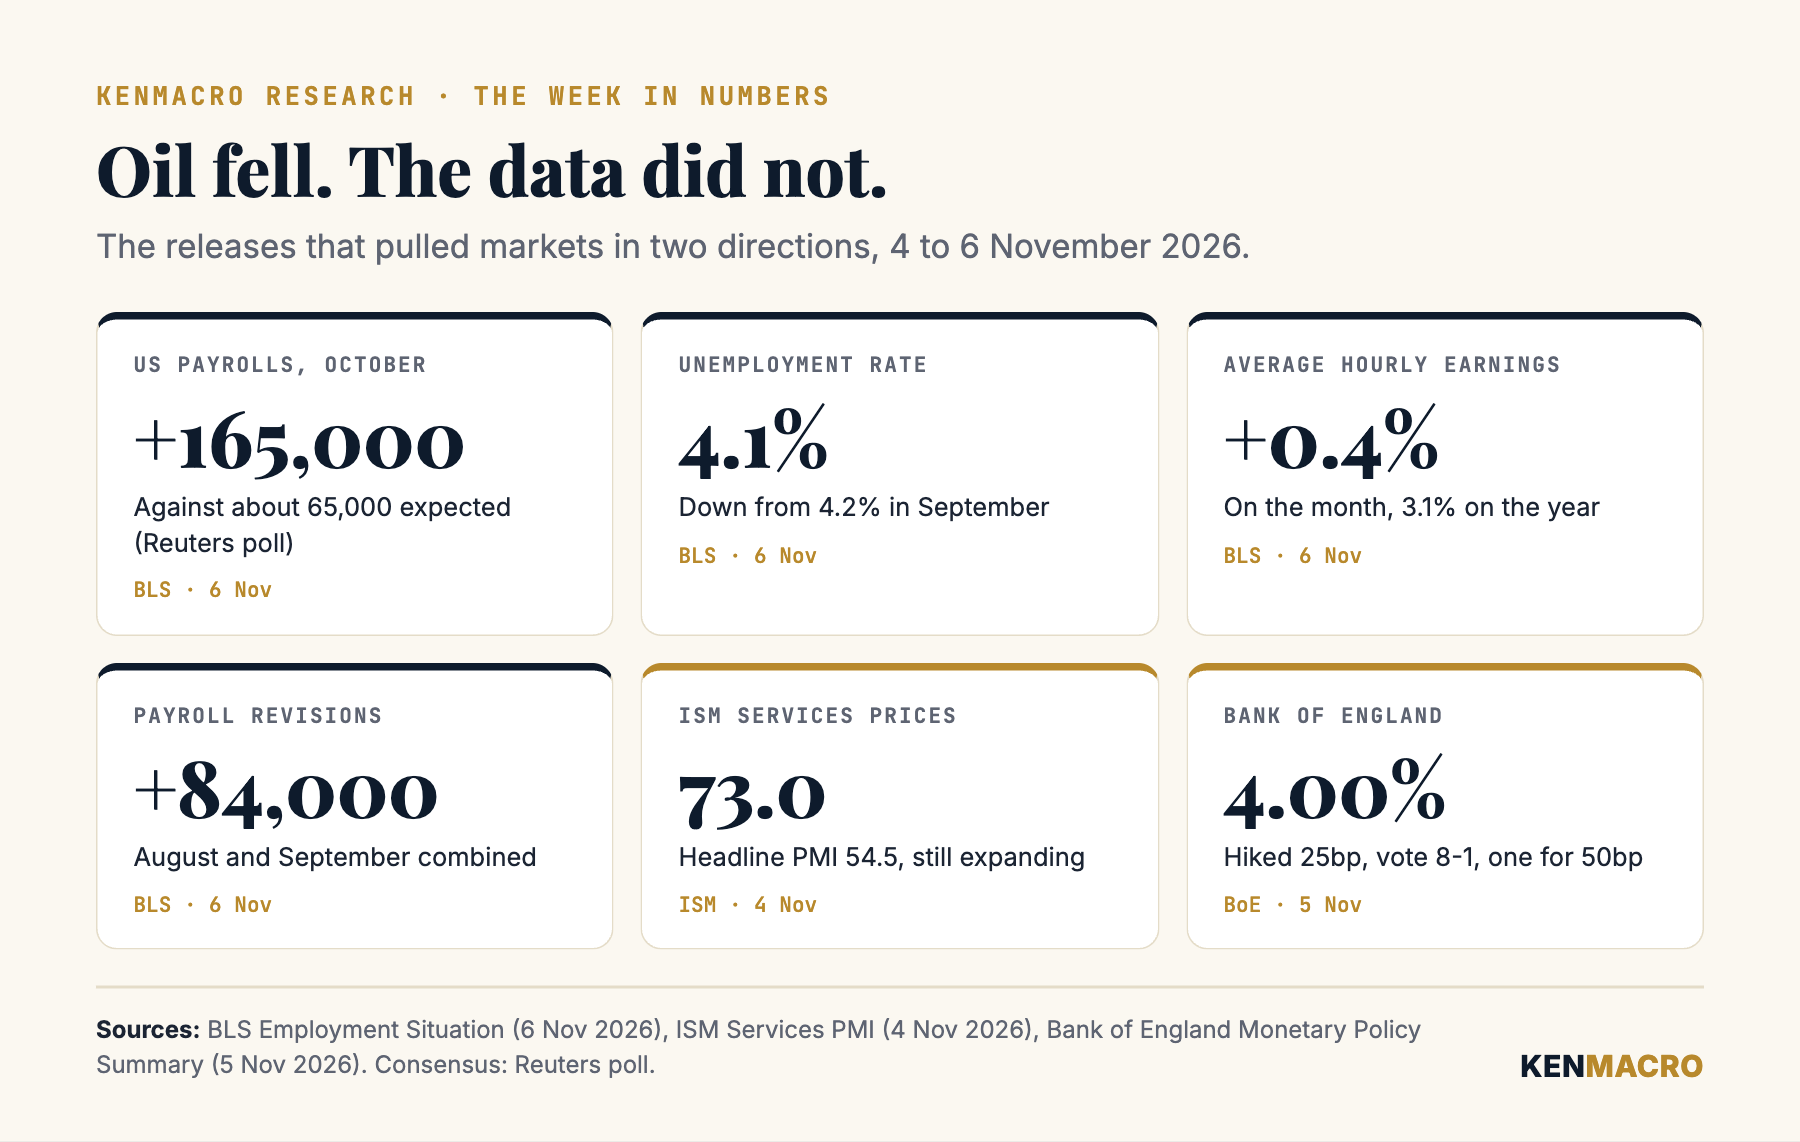
Now this is where the week gets really interesting. While traders were watching oil collapse and bond yields fall, the US labour market delivered a surprise. According to the Bureau of Labor Statistics, payrolls rose 165,000 in October against about 65,000 expected in a Reuters poll. Unemployment fell to 4.1% from 4.2%, and average hourly earnings rose 0.4% on the month to $38.00, which is 3.1% higher than a year ago.
There was another important detail. August was revised up by 53,000 to 186,000 and September by 31,000 to 60,000, a combined 84,000 more jobs than first reported. That’s not a weak report. It’s evidence that hiring has held up much better than the market assumed, and it lands on top of an ISM services survey on Wednesday that showed activity still expanding at 54.5 and the prices index still at 73.0.
Why does that matter so much for the Fed?
Let’s simplify it. Central banks raise interest rates to bring inflation under control, because higher rates make borrowing more expensive, cool some spending and investment and take pressure off prices. But the Fed also watches the labour market very closely. If companies are still hiring, unemployment is contained and wages are rising, the economy can tolerate restrictive rates, and the Fed has much less reason to worry about weakness.
That matters because the market has been hoping falling oil would make further hikes unnecessary. The Fed held at 3.75% to 4.00% on 28 October, but two officials, Lisa Cook and Beth Hammack, voted to hike again.
After Friday’s report a December hike was priced at roughly 75 to 80%, according to Reuters. Lower oil is disinflationary. A resilient labour market makes the Fed cautious about easing off. Both can be true at once, and that’s the conflict we’re trading.
| Indicator | Latest reading | Why it matters |
|---|---|---|
| October non-farm payrolls | +165,000 | Far stronger hiring than the roughly 65,000 expected |
| Unemployment rate | 4.1%, from 4.2% | The labour market is still tight enough to tolerate high rates |
| Average hourly earnings | +0.4% m/m, +3.1% y/y | Wage pressure the Fed has to keep watching |
| Payroll revisions | +84,000 for August and September | Earlier hiring was stronger than first reported |
| September job openings (JOLTS) | 7.5 million, little changed | Employers are still advertising plenty of vacancies |
| October ISM Services PMI | 54.5 | Services activity is still expanding |
| ISM Services prices index | 73.0 | Input costs are still rising at a significant pace |
This is exactly why I keep telling traders that one release never tells the whole story. You need to understand how the pieces fit together before you decide what the market is actually reacting to.
The Bank of England just showed why energy inflation lingers
There’s another decision from Thursday that deserves more attention. The Bank of England raised Bank Rate by 25 basis points to 4%, its first hike in over two years. The vote was 8 to 1, and the one dissenter, Catherine Mann, wanted to go further, to 4.25%. UK inflation was 3.5% in September, and the Bank expects it to reach around 5% by the middle of next year.
Think about the timing. Oil is collapsing on hopes of a deal, and the Bank of England is still raising rates.
The reason is that central banks have to deal with the inflation that has already worked its way into the economy, not just today’s crude price. Businesses are already carrying higher freight, energy and production costs, households are already facing bigger bills, and wage demands take time to adjust. There’s often a long lag between a commodity shock and the inflation numbers policymakers actually see.
This is something I think retail traders underestimate all the time. Markets look forward, but central banks have to balance their forecasts against the data that’s already in, and for a while the two can tell completely different stories. If you want to see how I teach this chain from first principles, from the data central banks react to through to rate decisions and policy divergence, it’s the backbone of the Macro Trading Blueprint.
Gold, the dollar, yields and stocks: why they aren’t moving together
Here’s how I’d approach the market from here. I wouldn’t assume every asset has to follow one neat relationship, because different forces are pulling prices in different directions.
Look at the week as a whole. Oil fell nearly 13% and the 10-year Treasury yield fell about 8 basis points, which on its own is the classic disinflation trade. But the Nasdaq 100 still lost almost 5%, the dollar rose on Friday after the jobs report, and gold rallied on the week while slipping after the data.
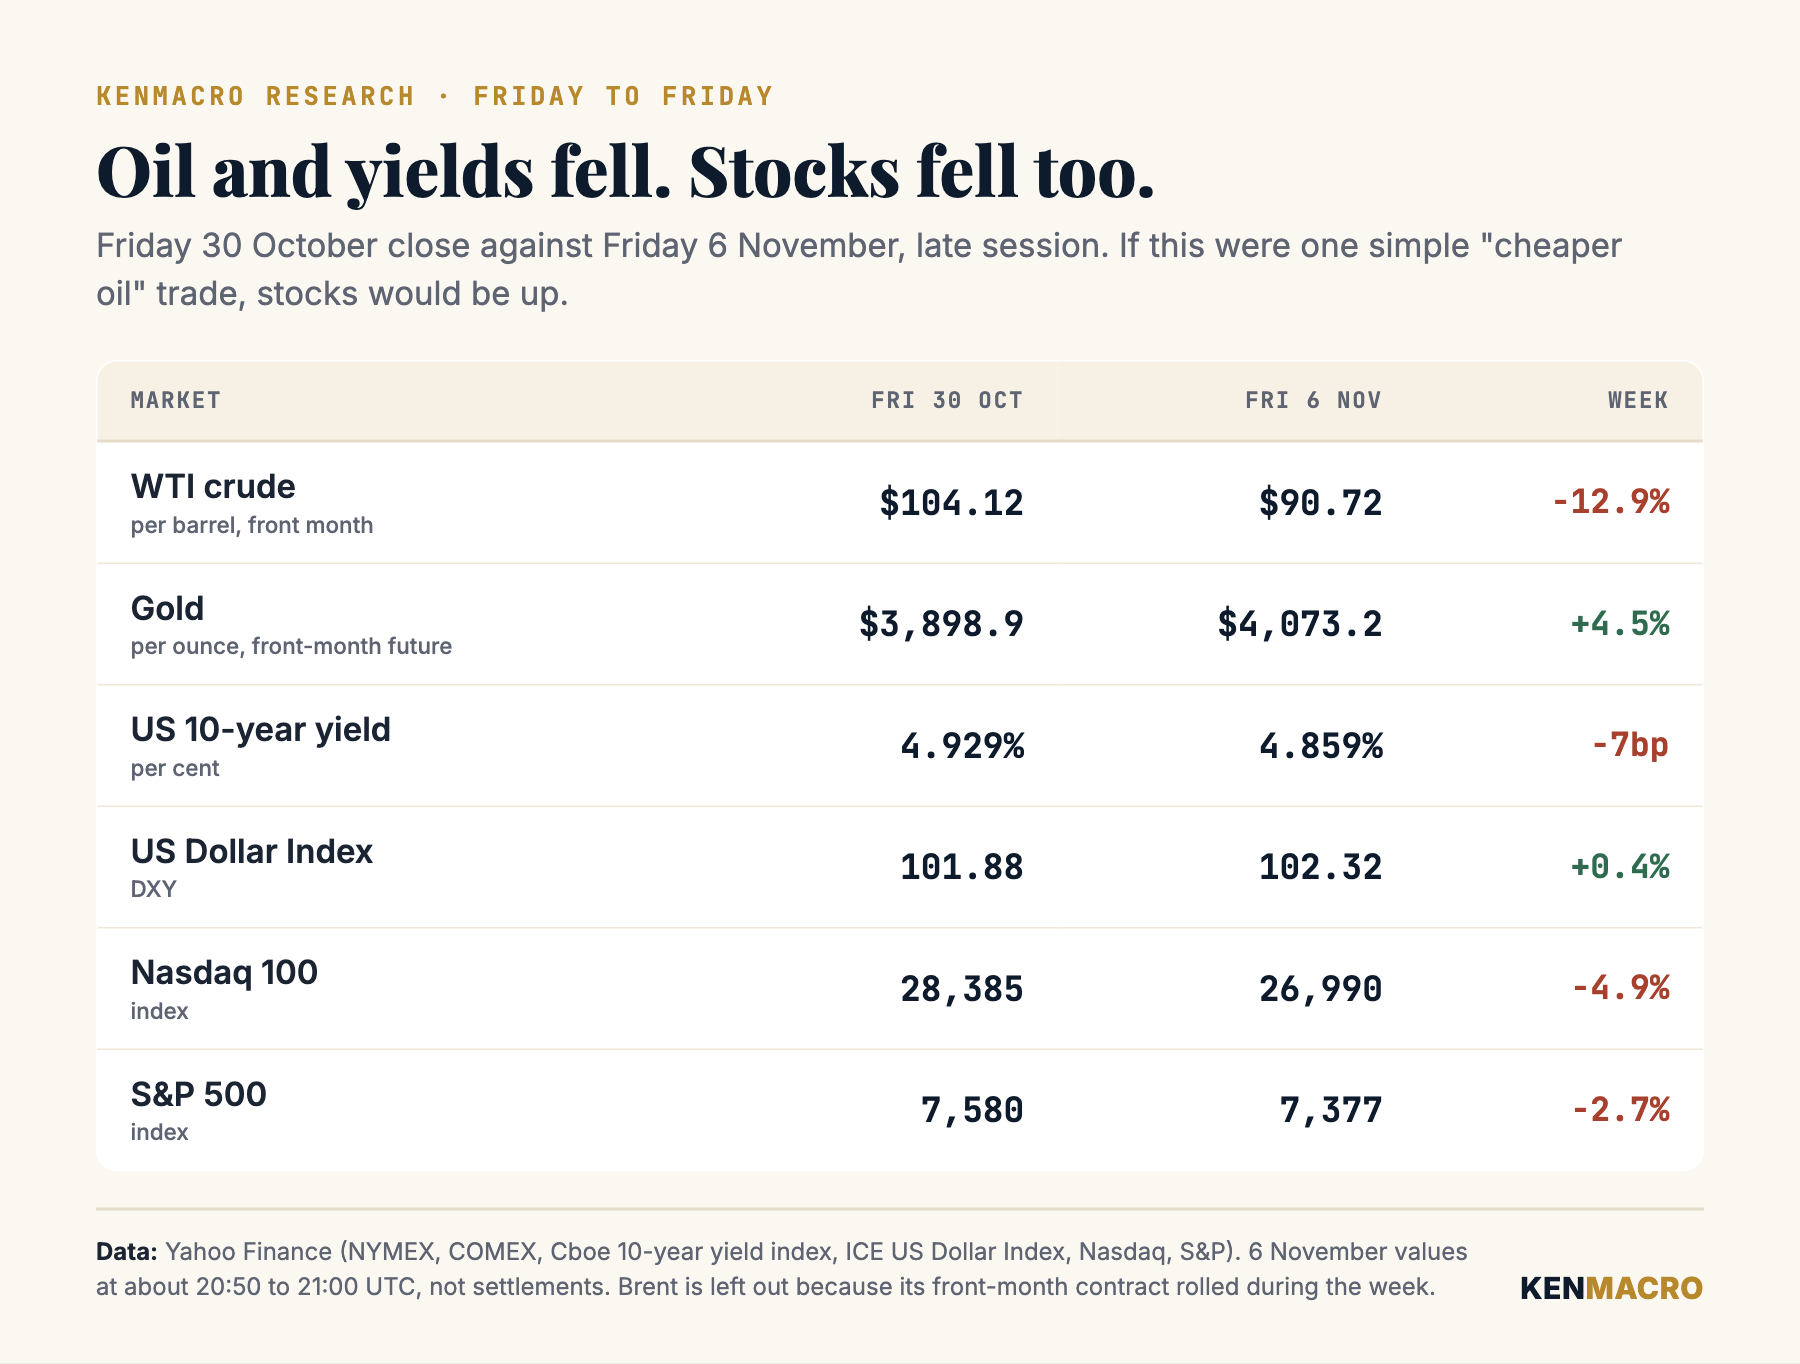
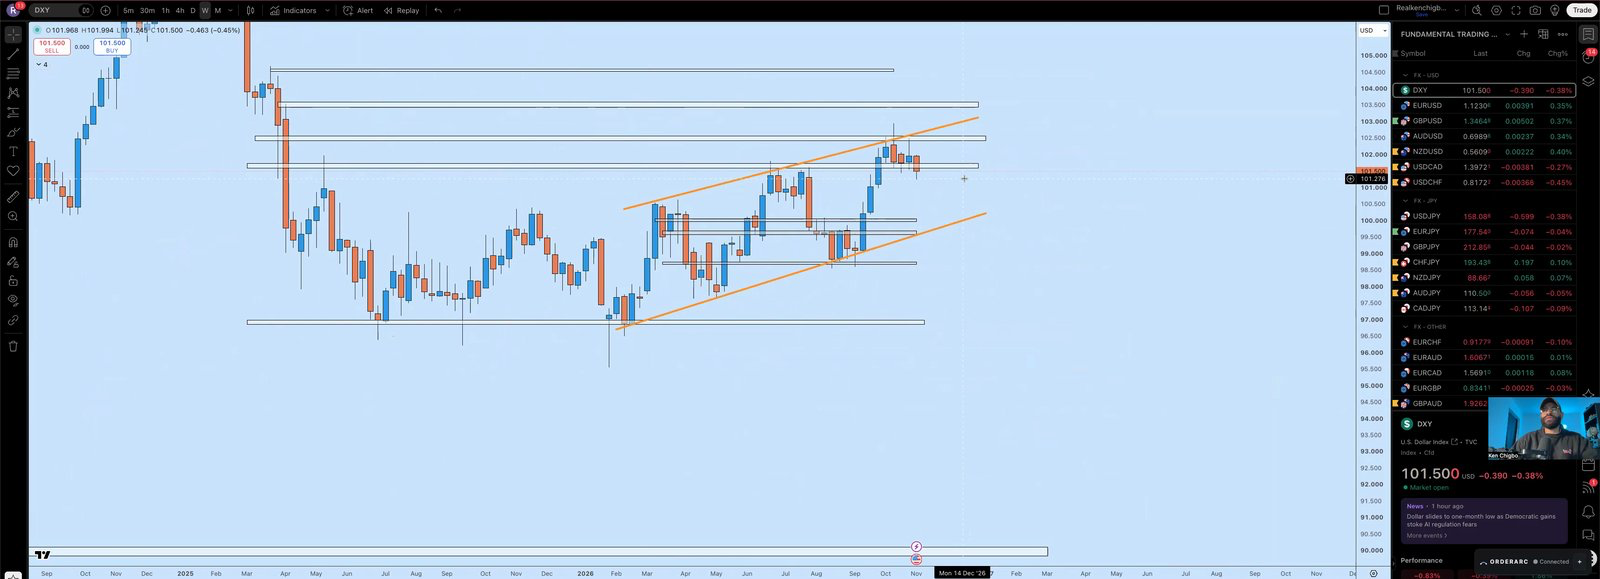
The bond market tells you a lot here. The 2-year yield fell from about 4.56% to 4.51% on the week and the 10-year from about 4.94% to 4.86%, but most of that came from Thursday’s flight to safety, and both rose on Friday after payrolls. In other words, lower oil hasn’t yet convinced the market that the Fed can relax. Gold sits right in the middle of that tug of war: lower real yields and fear help it, but a stronger dollar and hike pricing work against it.
Three scenarios for the weekend and beyond
Scenario one: diplomacy succeeds and oil keeps falling
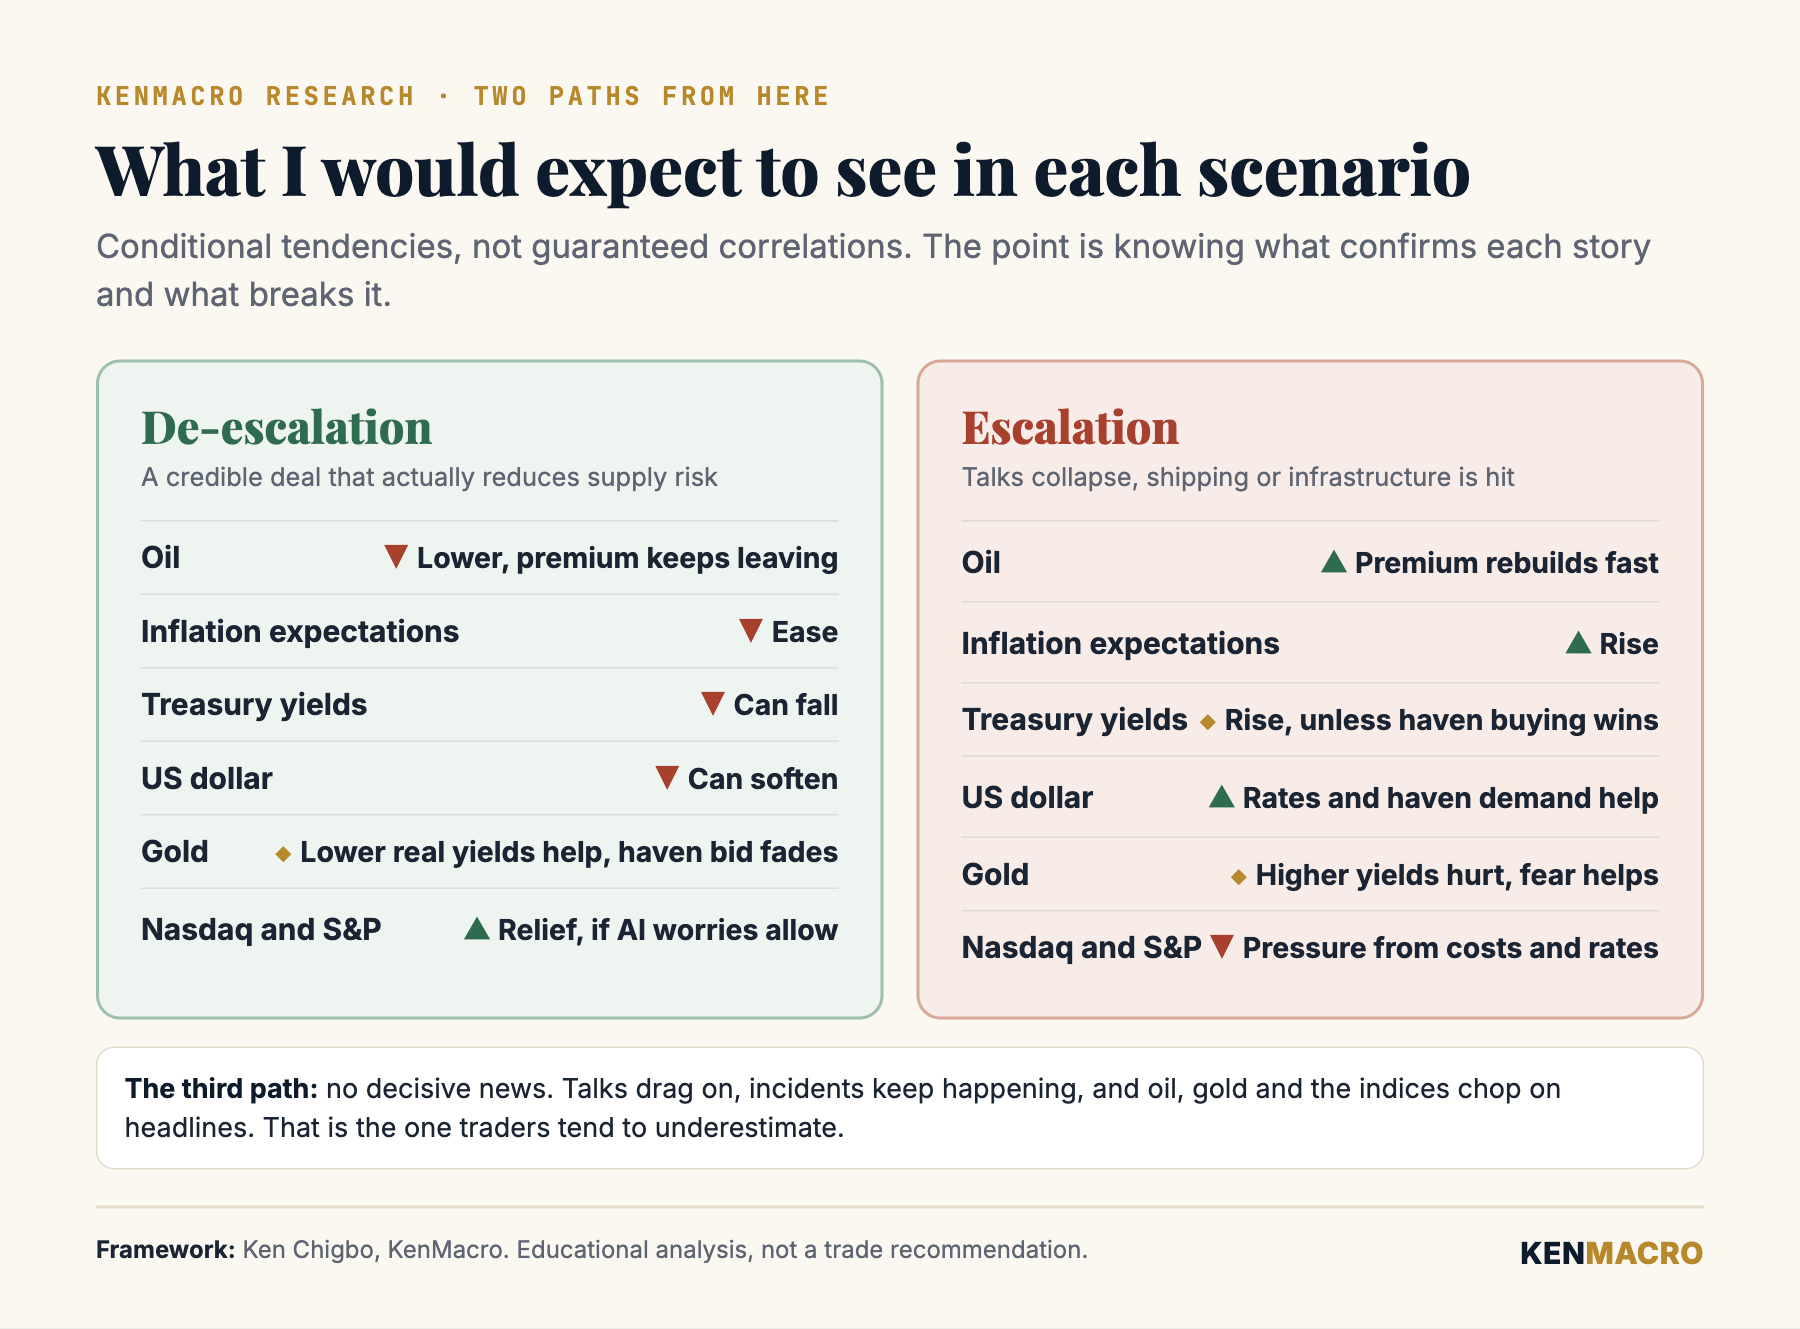
A credible agreement that genuinely reduces supply risk would strengthen the case for a less inflationary energy outlook. Oil could stay under pressure as more of the premium comes out, inflation expectations could ease, and Treasury yields could fall, especially if investors start to expect a less aggressive Fed. That would tend to weigh on the dollar, and lower real yields plus a softer dollar would usually support gold, while cheaper financing helps equity valuations, particularly growth stocks. There are exceptions, though. Gold can lose some of its haven demand as the fear fades, and energy stocks can struggle even if the wider market rallies.
Scenario two: talks collapse and escalation returns
Now reverse it. Fresh strikes, serious shipping disruption or damage to energy infrastructure could push crude higher again and revive inflation concerns. Bond yields could rise if markets start pricing a more hawkish response, the dollar could benefit from both rate expectations and haven flows, and equities would face pressure from energy costs and financing costs together.
Gold is the interesting one. Higher real yields and a stronger dollar are normally headwinds, but a genuine escalation can create defensive demand, so I wouldn’t say war automatically means gold up or gold down. I’d watch the bond market and the dollar alongside it.
Scenario three: no decisive development
This is the one traders tend to underestimate. Talks continue, neither side gives much, there are occasional military incidents followed by optimistic headlines, and oil, gold and the indices whip around and then give the moves back. That’s a recipe for choppy conditions, and until a new macro theme takes control it’s entirely possible this is what we’re left trading.
| Market | Sustained de-escalation | Renewed escalation |
|---|---|---|
| Oil | Downward pressure | Supply-risk premium rebuilds |
| Inflation expectations | Potentially lower | Potentially higher |
| Treasury yields | Could fall | Could rise, although haven buying may offset |
| US dollar | Potentially weaker | Could strengthen on rates or haven demand |
| Gold | Lower real yields help; haven demand may fade | Mixed: higher yields against defensive demand |
| S&P 500 and Nasdaq | Potential relief | Pressure from costs, rates and uncertainty |
These are conditional scenarios, not guaranteed correlations. The point is knowing what would confirm each story and what would break it, so you’re reacting to evidence rather than to the loudest headline.
What I’m watching on the charts
The technical picture is where all of this has to come together. A convincing headline isn’t enough. I want to see how the market reacts at the levels that matter.
WTI crude oil
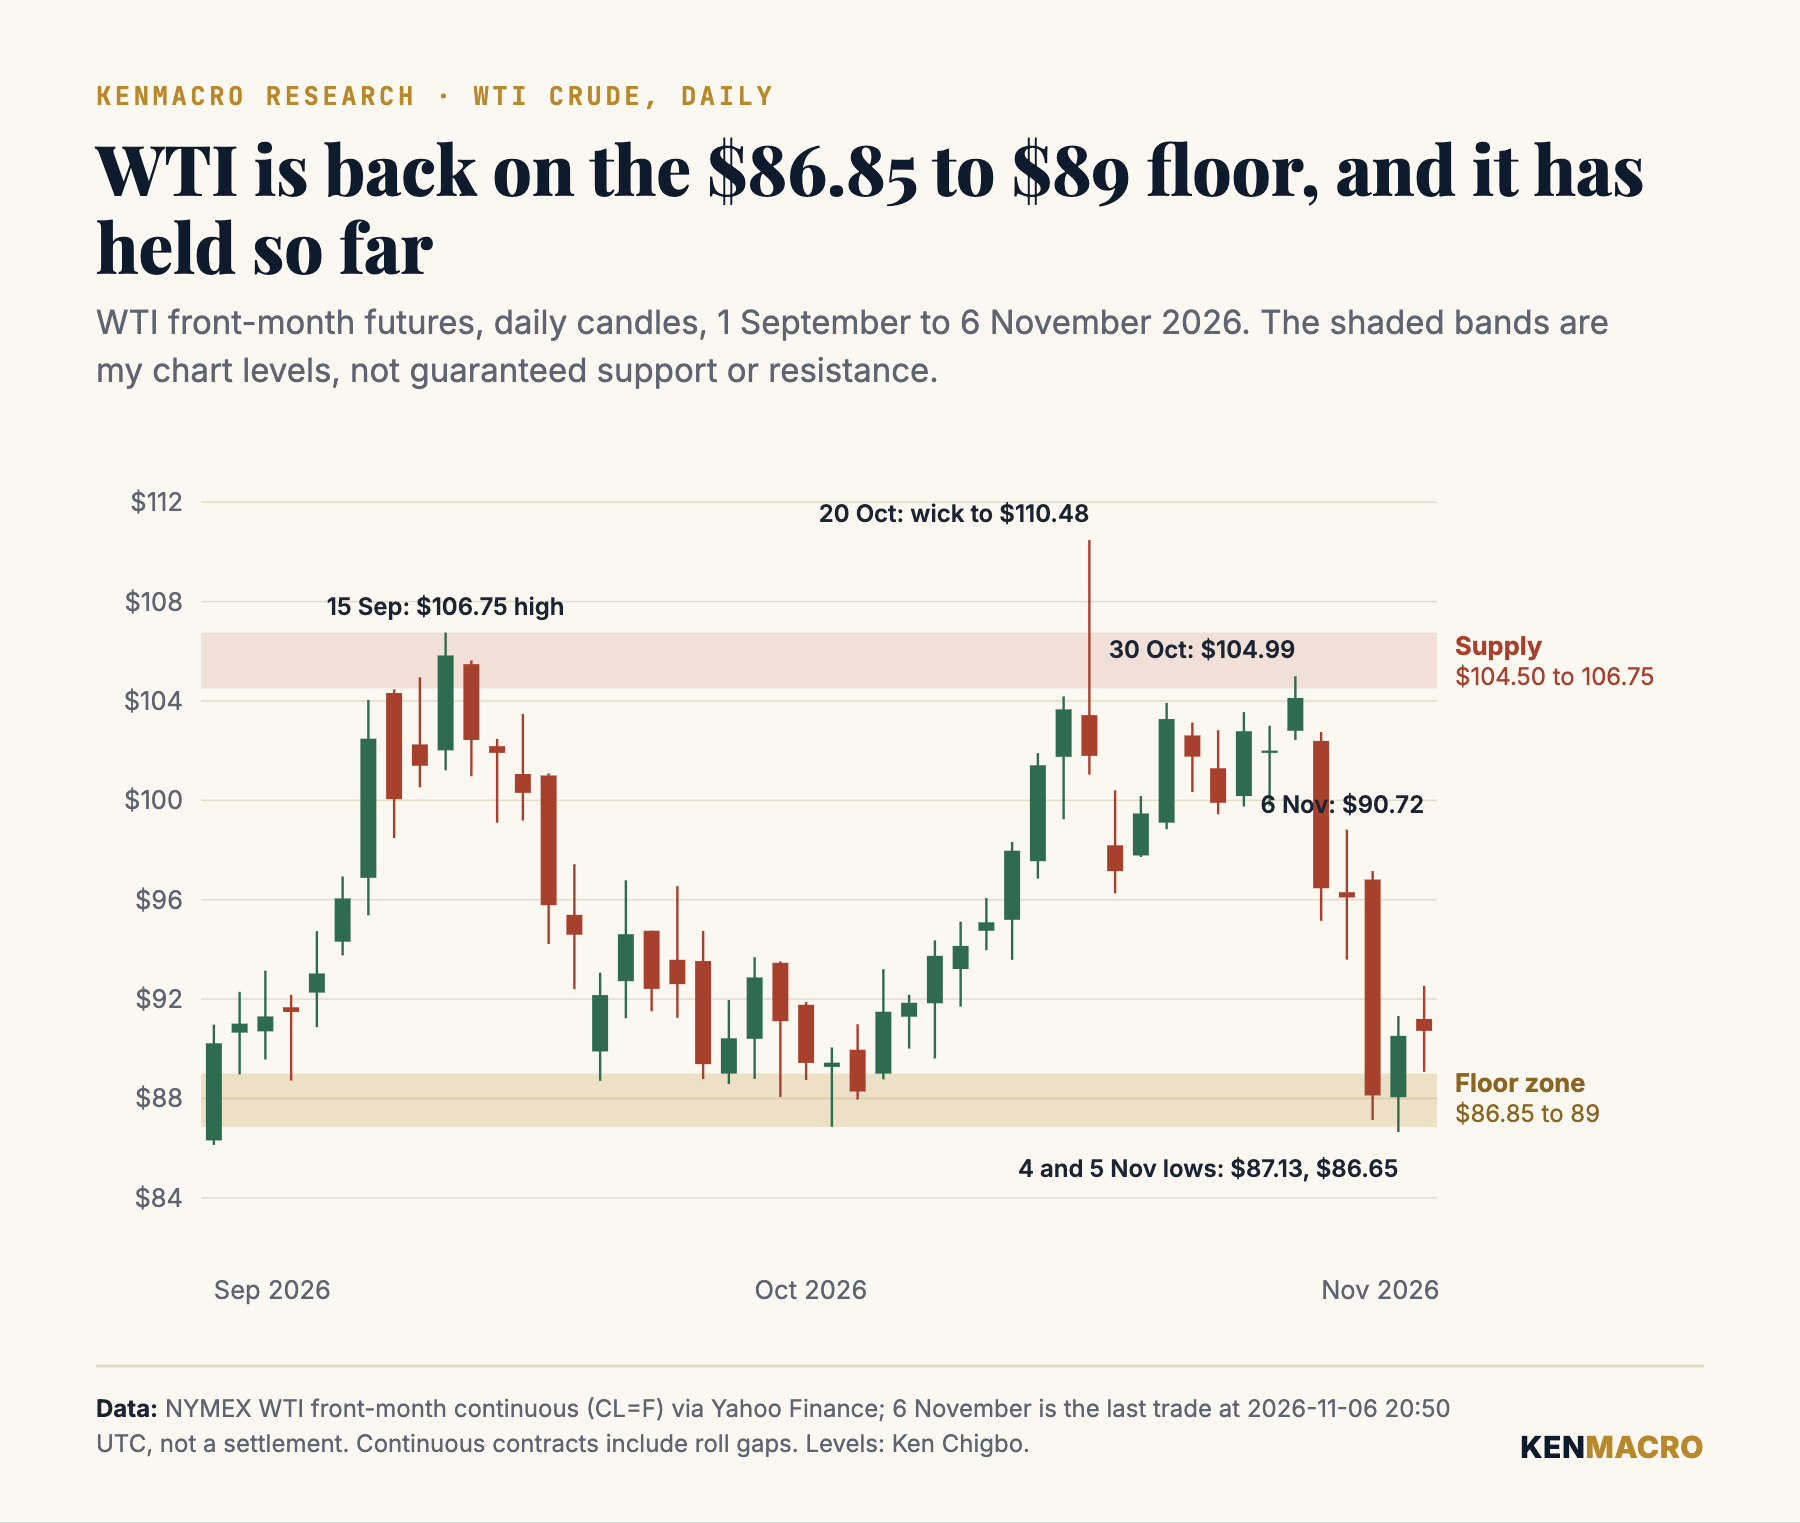
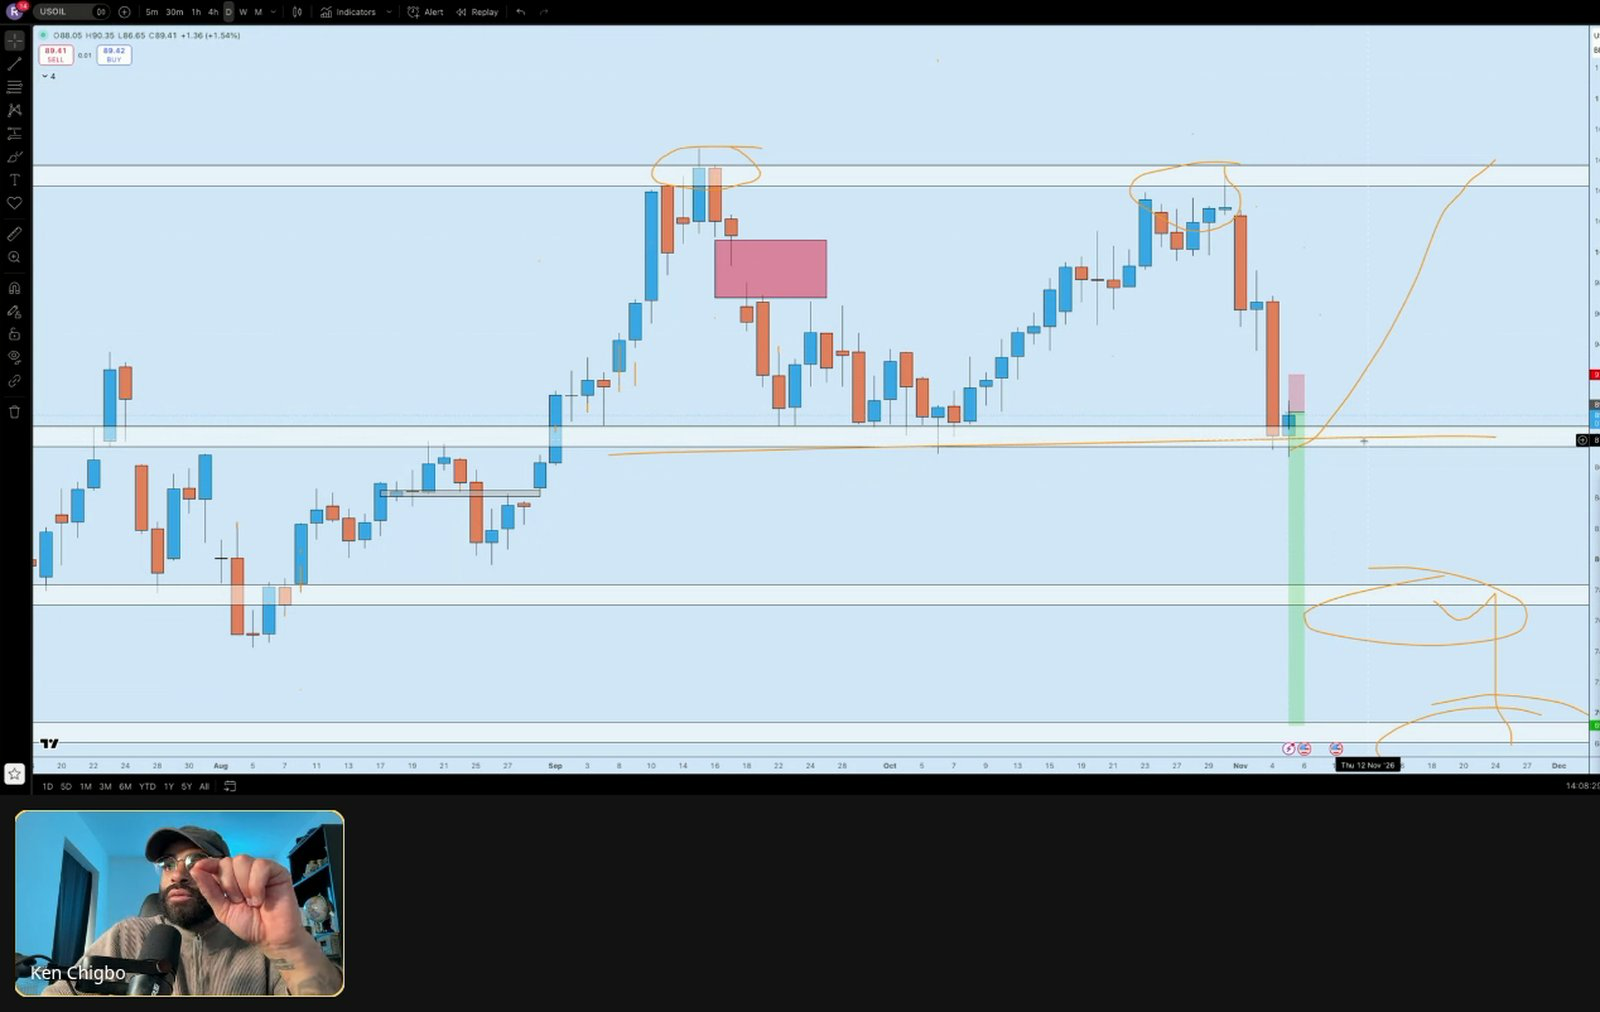
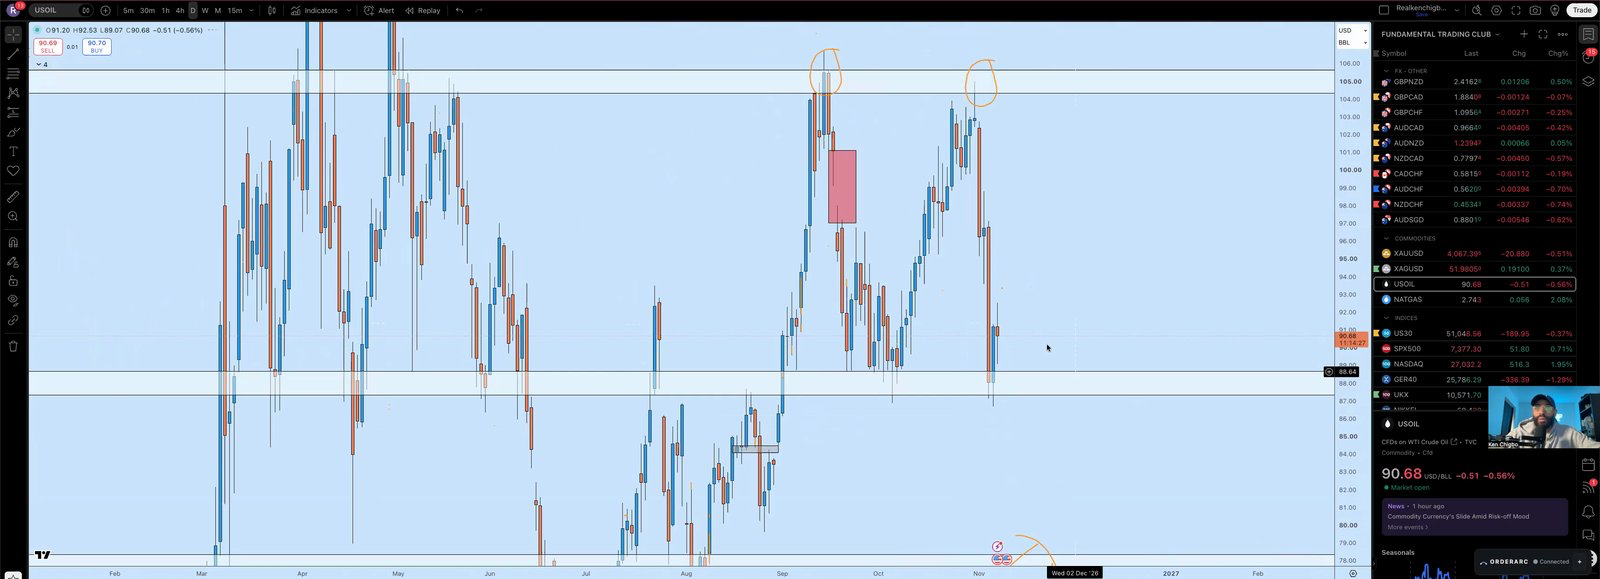
Earlier this week I highlighted the $86.85 to $89 area as historical support and a potential neckline zone on the daily chart. Price has now tested it twice. Wednesday settled at $88.12 inside the zone, Thursday traded as low as $86.65, just beneath it, and both days buyers took price back above $89. Friday finished around $90.80.
Levels aren’t magic numbers, though. What matters now is whether price breaks and holds below the zone, which would strengthen the bearish case, or whether buyers keep defending it and start reclaiming lost structure, which would raise the risk that the sell-off has gone too far, especially if the geopolitical temperature rises again. I’d also watch Brent and physical shipping conditions rather than relying on WTI alone.
US Treasury yields
I’m watching the 2-year for changes in near-term Fed expectations and the 10-year for the broader inflation, growth and duration story. If oil keeps falling but the front end stays elevated because of strong jobs and wages, that’s an important divergence. It would be telling you cheaper energy hasn’t convinced the market the Fed can relax.
Gold
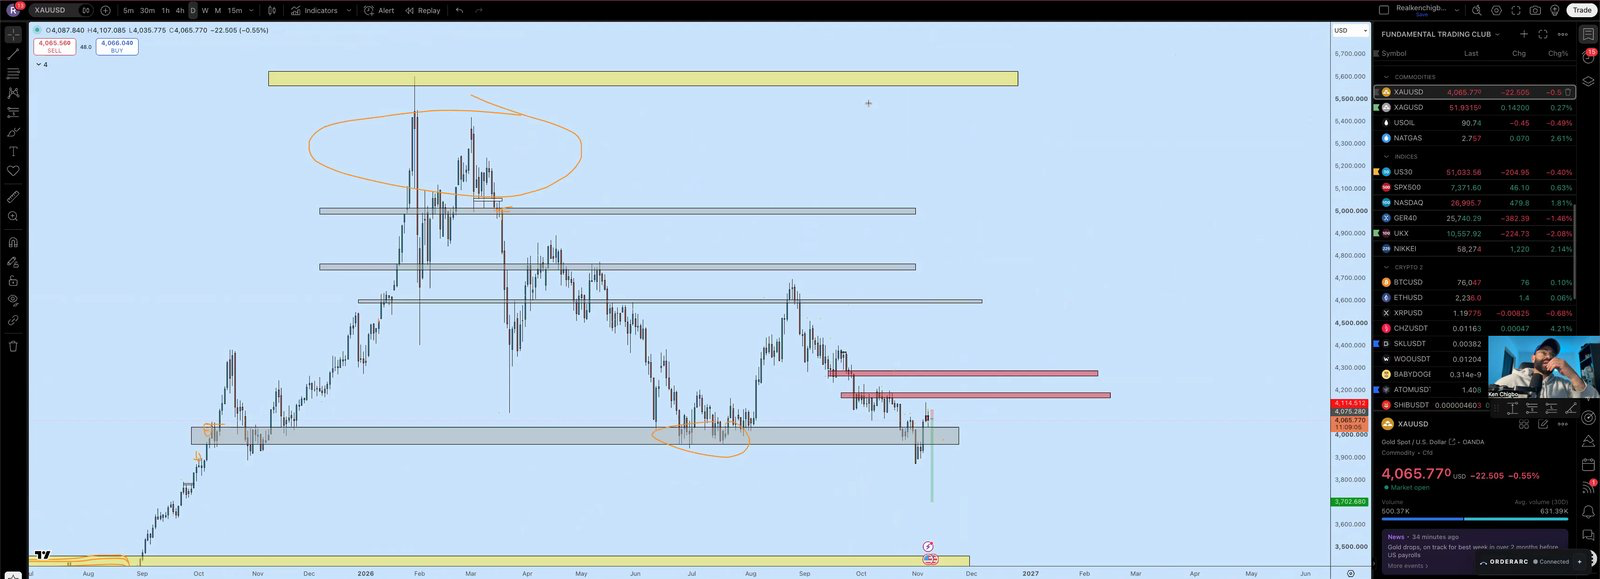
For gold, it’s the interaction between real yields, the dollar and the structure on the chart. If the dollar and real yields fall together, that’s generally a supportive backdrop. If both rise after strong US data, as they did on Friday, gold tends to struggle. Geopolitical haven demand can break that relationship, especially during a sudden escalation, which is exactly why I don’t trade gold off one headline. The Gold/XAUUSD Trading Mastery course in the Complete Trading Education is built around this chain, from what drives gold to the technical toolkit and two complete strategies.
Nasdaq and the S&P 500
Thursday showed that worries about AI investment, valuations and financing costs haven’t gone anywhere just because oil is falling. Lower rates can help growth valuations, but they don’t answer the questions about earnings, debt-financed infrastructure and the return on all that spending.
For the indices, I want to see the structure confirm improving risk appetite rather than chasing the first bounce after a crash. And if the macro story and the chart disagree, I don’t force the trade. That’s often where patience is worth more than a strong opinion.
The weekend question traders shouldn’t ignore
The markets close for the weekend. The Middle East doesn’t. Negotiations can move forward while markets are shut, but so can military operations and political decisions, and markets can reopen at very different prices from where they closed on Friday. So heading into the weekend, I wouldn’t be trying to predict exactly what Trump will do.
I’d be asking a different set of questions. What happens if the talks produce a credible agreement? What happens if they collapse? What happens if nothing changes?
Which assets are likely to react first, and what market behaviour would tell me my interpretation is wrong? Those are far more useful questions than guessing whether oil goes up or down on Monday.
Next week: inflation could be the next big catalyst
There’s one more reason the timing matters. The US publishes October CPI on Tuesday 10 November and October PPI on Friday 13 November. September’s headline CPI was 3.7% year on year, with gasoline up 9.1% on the month, so the market will be looking for evidence that the energy shock is starting to fade from the data or that it’s still working its way through.
A cooler report would strengthen the disinflation story. A hotter one, on the back of Friday’s jobs numbers, would reinforce expectations that the Fed has to hike again in December, and either outcome could be overtaken by fresh news from Iran. That’s the market we’re trading. A geopolitical event changes inflation expectations, inflation expectations move the bond market, and the bond market moves the dollar, gold and equity valuations. It’s all connected.
My final thoughts
This has been a remarkable week. The Democrats have won Congress, oil has collapsed, Trump and Qatar are discussing a diplomatic route, Iran is still a serious military and shipping risk, US hiring has come in far stronger than expected, and central banks are still dealing with the inflation from a conflict that hasn’t ended.
I don’t think this is a market where you should marry one narrative. There are too many moving parts. What matters is understanding what the market is pricing, what could change that view and how price responds. The next big move in oil, gold, the dollar or the Nasdaq might have very little to do with a chart pattern. It could be a phone call, a military incident or Tuesday’s inflation report, and the traders who understand how those events connect will be in a far better position to read what happens next.
- Live New York sessions with me, Monday to Friday at 14:00 UK
- Every session recorded, with chapters
- The education library while you’re subscribed
- The community, plus the Structure Desk indicator on request
- All 5 courses, 116 lessons, yours for life, including the Macro Trading Blueprint
- 12 months in the Trading Club included
- Live sessions, replays, community and the Structure Desk indicator on request
- No subscription and no auto-renewal
Frequently asked questions
Why are oil prices falling in November 2026?
Oil fell sharply in the first week of November 2026 as traders priced a greater chance of US and Iran de-escalation after the midterm elections and renewed mediation through Qatar. WTI fell about 12.8% on the week to around $90.83, and January Brent about 13.3% to $98.32, as the market removed part of the geopolitical risk premium. There is no confirmed peace agreement.
Did Trump and Qatar reach a peace agreement with Iran?
No. Trump and Qatar’s Emir spoke on Friday 6 November about Qatar’s mediation, and Qatar’s readout referred to efforts to reach a comprehensive agreement, but no deal had been announced at this article’s research cut-off. Qatar said on 3 November that bridging the gap was still a work in progress.
What did the October 2026 US jobs report show?
The US economy added 165,000 non-farm jobs in October, against about 65,000 expected in a Reuters poll, according to the Bureau of Labor Statistics report released on 6 November. Unemployment fell to 4.1%, average hourly earnings rose 0.4% on the month and 3.1% on the year, and August and September were revised up by a combined 84,000.
Will the Fed raise rates in December 2026?
Markets priced a December hike at roughly 75 to 80% after the jobs report, according to Reuters. The Fed held at 3.75% to 4.00% on 28 October with two officials voting to hike. October CPI on 10 November and PPI on 13 November are the next big tests before the 8 and 9 December meeting.
Does falling oil mean the US dollar will fall?
Not necessarily. Lower oil can reduce inflation expectations and pull Treasury yields down, which tends to weigh on the dollar. But strong economic data, rate expectations, risk appetite and safe-haven demand can all change the outcome, and the dollar rose on Friday after the jobs report even though oil was sharply lower on the week.
Is an Iran escalation bullish or bearish for gold?
It depends on which forces dominate. Escalation can increase safe-haven demand for gold, while higher bond yields and a stronger dollar can push it lower. Watch real yields, the dollar and the structure on the chart alongside the geopolitical news rather than assuming one fixed relationship.
What is included in the KenMacro Complete Trading Education?
It includes all five KenMacro courses, 116 lessons with lifetime access, including the Macro Trading Blueprint, Technical Trading 101 and Gold/XAUUSD Trading Mastery, plus 12 months in the KenMacro Trading Club with live sessions, replays and the community. It costs £499 in one payment with no subscription, and that is the total at checkout in the UK.
Get the macro framework the desk actually trades
The same regime-first framework behind every call on this site. Free. No spam, unsubscribe anytime.
Continue reading
From the desk
Where this gets traded
Oil reprices in violent, headline-driven gaps, and execution through a supply shock is the whole game. See the KenMacro desk guide to the best brokers for trading oil.
Read the desk guide →