
Oil Tankers Are Being Attacked. So Why Is Oil Falling? The Iran War, Strait of Hormuz and OPEC+ Explained
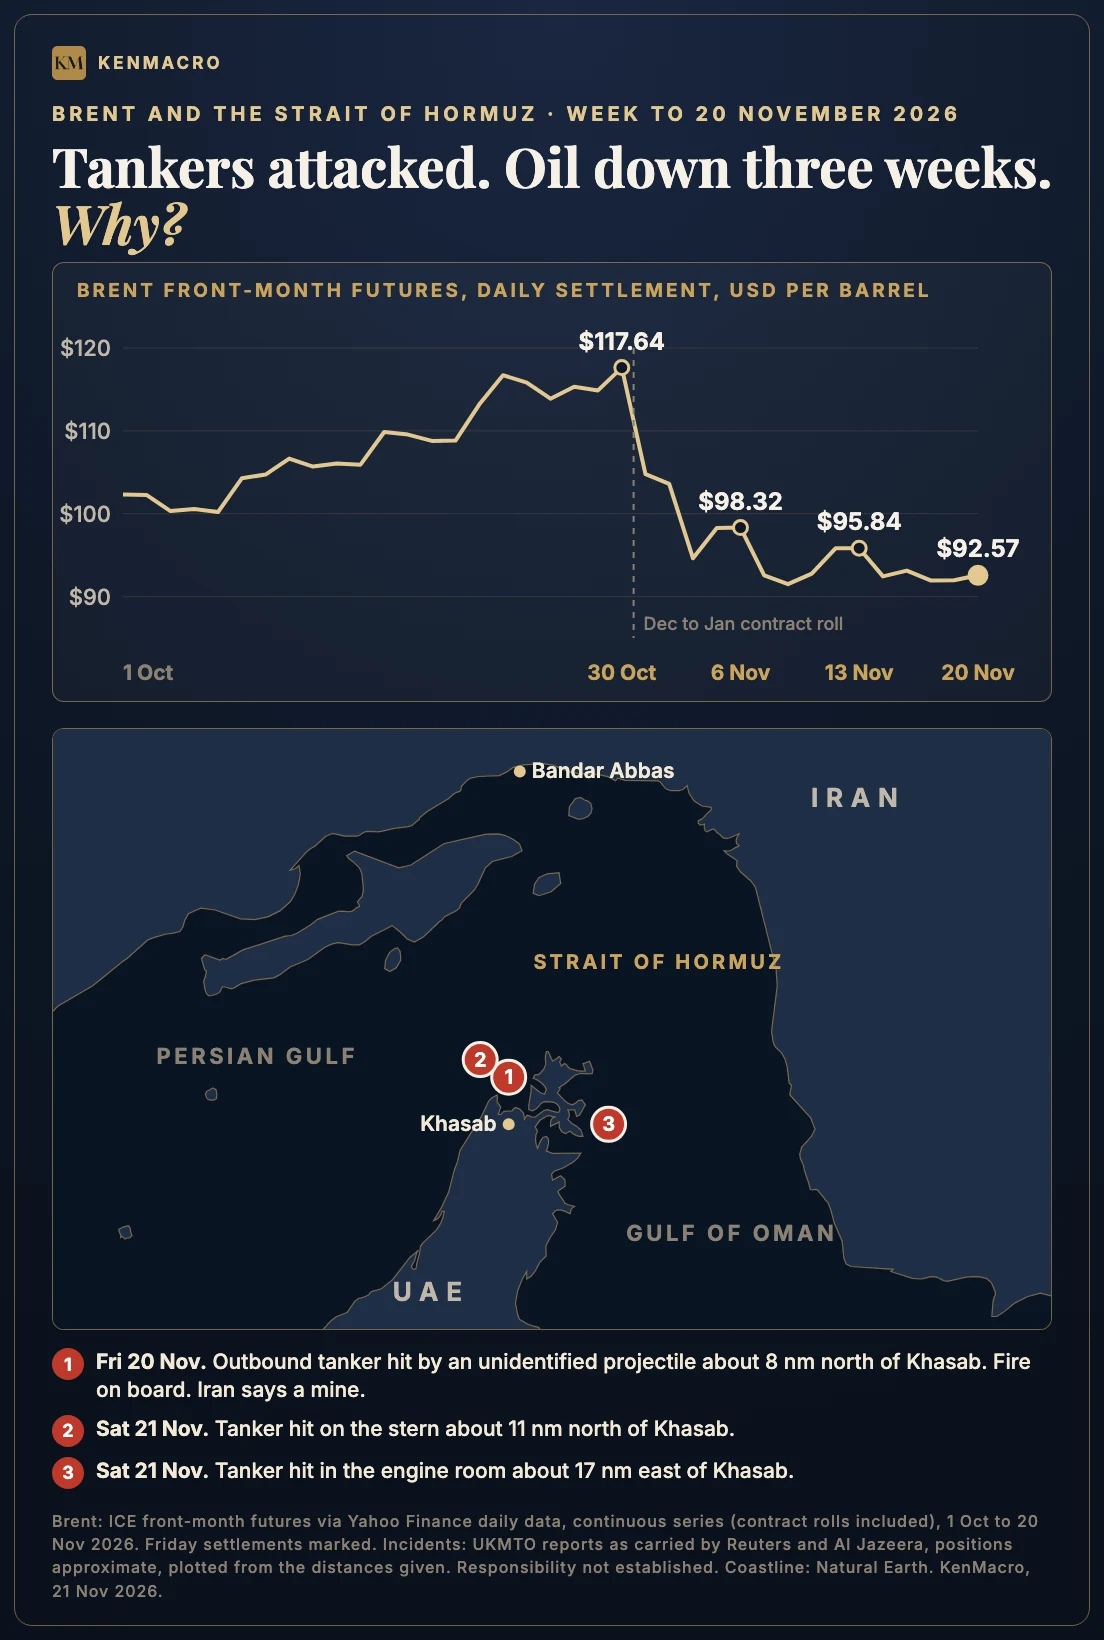
Now, hold on a minute. We have an ongoing war involving Iran, one of the world’s most important oil shipping routes is still under threat, and attacks on commercial vessels are continuing. Surely oil should be exploding higher? So why isn’t it? Because the most important question in markets isn’t always what’s in the headlines. It’s what is already priced in, and what is actually changing underneath those headlines. Right now the oil market is asking a very different question from the one it was asking a few months ago.
That distinction is the whole story, so let’s work through it properly.
Three weeks of falling oil prices, despite escalating tensions
Here is where oil finished the week.
| Contract | Settlement | Friday | Week |
|---|---|---|---|
| Brent crude, January futures | $92.57 | +$0.59 | −3.41% |
| WTI crude, expiring December futures | $83.98 | +$0.77 | −5.17% |
Both benchmarks actually rose on Friday, as the tanker fire revived war fears and traders squared positions before the weekend. But that bounce wasn’t enough to change the bigger picture, and both finished lower for a third consecutive week. Brent settled at $95.84 the Friday before, and $98.32 the Friday before that.
This is why I separate the daily reaction from the broader macro picture. A tanker attack can make prices jump, and a threatening headline can force short sellers to cover. Yet the larger trend can stay under pressure if the underlying supply outlook is becoming less restrictive. A market can be nervous about the next headline without believing the physical shortage is getting worse, and that is exactly what traders need to understand here.
What happened in the Strait of Hormuz?
On Friday 20 November, UKMTO reported that a tanker sailing outbound through the Strait of Hormuz had been struck by an unidentified projectile about eight nautical miles north of Khasab, Oman, and that a fire had broken out on board. No casualties were reported. Iran’s Revolutionary Guards gave a different account through state media, saying the ship had hit a mine.
On Saturday 21 November UKMTO reported two further incidents: a tanker hit on its stern about 11 nautical miles north of Khasab, and a tanker hit in its engine room about 17 nautical miles east of Khasab. At the time of writing nobody had claimed responsibility, and it was not clear whether the reports involved separate vessels. I’m not going to guess who is behind them. Responsibility should be established by investigators, not assumed in a market note.
The wider point is clear, though. Before the war, around a fifth of the world’s oil consumption flowed through this one narrow corridor, which connects the Persian Gulf producers with the rest of the world. A strait only about 21 nautical miles wide at its narrowest point can move the price of petrol, diesel and jet fuel, inflation expectations and government bond yields everywhere. That’s why the market can’t ignore these incidents. But there’s another side to the story.
The number that matters more than the headline
This is where it gets interesting. The IEA’s November Oil Market Report, published on 13 November, says global oil supply rose by 2.3 million barrels a day in October to 105.4 million barrels a day. That’s an extraordinary 5.3 million barrels a day of extra output since August, and the IEA puts it down to strong Gulf exports.
Gulf crude flows rose to 15 million barrels a day in October, equal to 82% of their pre-war level. Gulf oil exports in total, excluding Oman, reached 18.4 million barrels a day, which is still 26% below pre-war levels. So the crisis is clearly not over, and anyone telling you traffic is back to normal is wrong. But it is a very different supply picture from the one traders feared when they were pricing an almost complete, prolonged shutdown.
| Measure | Reading |
|---|---|
| World oil supply, October | 105.4 mb/d, up 2.3 mb/d on the month |
| Gulf crude flows, October | 15 mb/d, 82% of pre-war |
| Gulf oil exports excluding Oman, October | 18.4 mb/d, 26% below pre-war |
| Observed global inventories, October | +52 mb, the first rise since June |
| Oil on water, October | +86 mb, highest since January |
| World oil demand, 2026 forecast | 102.3 mb/d, down 2.7 mb/d on 2025 |
| Market balance | Return to surplus in Q4 2026, larger build in 2027 |
Look closely at the inventory line, because there’s a nuance most coverage skips. Observed stocks rose by 52 million barrels in October, but that was driven by oil on the water, which jumped 86 million barrels as Gulf cargoes set sail. Stocks on land kept falling and, according to the IEA, are at their lowest since at least 2016. The barrels are moving again, but they haven’t yet refilled the tanks.
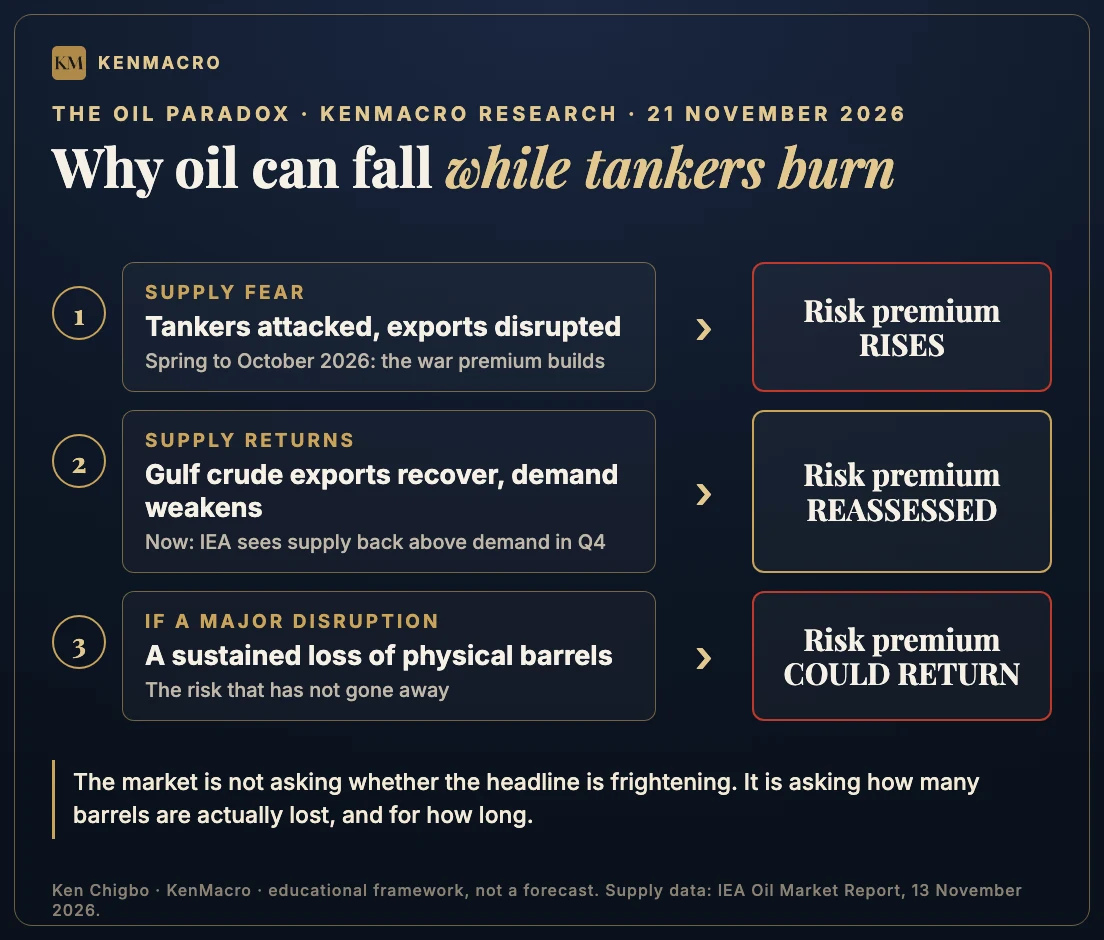
Put it together. More oil is moving, production has recovered sharply and demand is under pressure. Suddenly the market has to reconsider how much war risk it should be pricing into every barrel. That doesn’t eliminate the danger. It changes the balance between the risk of disruption and the evidence of recovering supply, and that is precisely why oil can fall while tanker attacks continue.
The market doesn’t price fear indefinitely
Let’s make this really simple. Imagine the market expects a shipping disruption to remove several million barrels a day from global supply. Prices surge, because traders are pricing a shortage. Now imagine that weeks later tankers are still being attacked, but more cargoes are reaching their destinations and production is recovering. The headlines still look frightening, but the physical shortage the market feared is smaller than expected, so the risk premium starts coming out and oil falls.
Now reverse it. Imagine attacks escalate and a major export route becomes unusable for a long period. Insurance and freight costs rise, cargoes are delayed and buyers start competing for a much smaller pool of barrels. Oil can reprice violently higher again. The market isn’t deciding whether the news is frightening. It’s deciding how much oil will actually be available, and at what cost. That’s why I pay attention to supply flows, inventories, policy decisions and positioning rather than headlines alone. It’s the difference between understanding the story and simply reacting to it.
But there’s another problem: demand
Supply is only half the equation. The other half is how much oil the world actually needs, and the IEA now forecasts global demand falling by 2.7 million barrels a day in 2026 to 102.3 million barrels a day, before rebounding by about 2 million barrels a day in 2027. When demand is contracting while supply recovers, the market can swing from an expected shortage towards a surplus, and that weighs on crude.
There’s a distinction worth holding on to, though. A surplus of crude doesn’t mean every refined fuel is suddenly plentiful. With stocks on land at multi-year lows, diesel and other products can stay tight even while Brent falls, because refining capacity, shipping routes and regional shortages matter as much as the crude price. You can have falling Brent and serious stress elsewhere in the energy complex at the same time, which is why I never look at a single oil chart and assume it tells the whole story.
What lower oil means for inflation and the Federal Reserve
This isn’t just an oil story. It’s an inflation story, and potentially an interest rate story. Oil feeds into transport, freight, manufacturing and energy costs, so a sustained decline can ease some inflation pressure over time. But the transmission isn’t immediate or automatic. Refined fuel prices, exchange rates, demand and the broader inflation picture all sit in between.
That’s where the Federal Reserve comes in. Lower energy prices could help the inflation outlook, but lower oil alone doesn’t guarantee lower interest rates. With 10-year Treasury yields around 5% this week and the Fed still debating whether more tightening is needed, policymakers will want to see underlying inflation cool, not just the oil price. And if oil surges again on a serious supply disruption, the inflation picture gets more complicated, not less.
So the chain I’m watching is straightforward: oil, then inflation expectations, then Fed policy, then Treasury yields, then the US dollar, and from there gold, FX and equities. That doesn’t mean every asset moves mechanically in the same direction. It means these markets are connected, and whether you’re trading gold, the Nasdaq, currencies or crude, you need to understand those connections. I made the same point about gold on Tuesday in Why Is Gold Falling Despite the Iran War?, and it applies just as much here.
The Canadian dollar is another market worth watching
Canada is a major energy exporter, so oil can influence the Canadian dollar through the trade outlook and wider market expectations. If crude stays under sustained pressure, that can be a headwind for the loonie, all else being equal, which matters for USD/CAD. But I wouldn’t blindly buy USD/CAD just because oil is lower. I also want to know what the Bank of Canada and the Fed are doing, how yields are moving and whether price structure supports the idea. The macro gives me the context, and the chart tells me whether there’s a trade. That principle doesn’t change because we’re talking about oil instead of gold.
What we’ve been discussing at KenMacro
This sell-off hasn’t come out of nowhere. Throughout November I’ve been writing about how markets are reassessing the Iran war, the impact of possible diplomacy and the link between oil, inflation and the Fed. Each piece below was written on its own date with the information available then, and I’ve left them exactly as published.
- 4 November 2026. Oil Is Crashing. Democrats Have Won Congress. Is the Inflation Trade Finally Turning? WTI had fallen below $89 and Brent to about $95, and the question was whether the inflation trade was turning.
- 6 November 2026. Trump Is Talking Peace. Iran Is Still Fighting. And the US Jobs Report Just Complicated Everything. WTI fell nearly 13% on the week as de-escalation talk met a strong payrolls report.
- 17 November 2026. Why Is Gold Falling Despite the Iran War? Why the war bid in gold was losing to real yields, oil and a hawkish Fed.
The question then was whether the moves reflected a genuine change in supply expectations or just a temporary drop in geopolitical risk. That same question matters now. You can hold a perfectly reasonable bullish oil view during a supply shock, then exports recover, demand weakens, barrels start moving again, and the original thesis needs reassessing. I don’t see that as a weakness. That’s what proper market analysis is supposed to look like.
Sunday 29 November: OPEC+ could change the outlook again
The next major event on my radar is Sunday 29 November. At their 1 November meeting, the seven OPEC+ producers that have been meeting monthly (Saudi Arabia, Russia, Iraq, Kuwait, Kazakhstan, Algeria and Oman) kept December output targets unchanged and set their next meeting for 29 November. Reporting around that meeting framed the next one as a tougher call on 2027 production.
That matters because the group can shift expectations about future supply, and with the IEA already pointing to a surplus, its decisions and guidance carry more weight than usual. But OPEC+ isn’t the only variable. Over the coming week I’m also watching whether the tanker attacks stay isolated, whether Gulf export volumes keep recovering, whether shipping and insurance costs climb, and how traders react if the backdrop deteriorates over the weekend. Those questions matter just as much as the next production announcement.
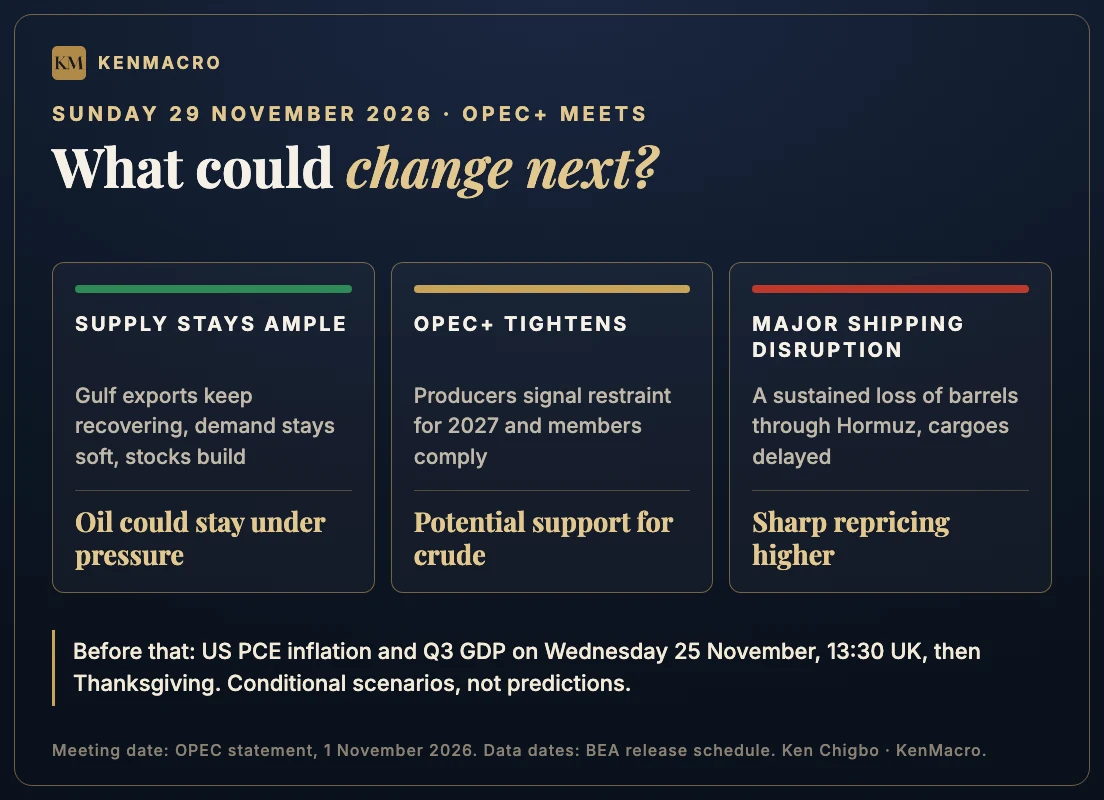
My oil market scenario map
| Scenario | What I’d watch | Potential market response |
|---|---|---|
| Gulf exports keep recovering | Crude flows, inventories, demand | Oil could stay under pressure |
| A major physical supply disruption | Export route closures, damaged infrastructure, delayed cargoes | Sharp repricing higher |
| OPEC+ signals tighter future supply | Production policy and compliance | Potential support for crude |
| Demand weakens further | Economic activity, refinery runs, inventory builds | Renewed downside pressure |
| Fears ease without a lasting supply loss | Shipping flows and the risk premium | More volatility, or a further fall in the premium |
What about Wednesday’s US data?
Before we even reach OPEC+, Wednesday 25 November brings another test. The US releases October personal income and outlays, including PCE inflation, alongside the second estimate of third-quarter GDP, both at 08:30 Eastern Time, 13:30 UK, according to the BEA schedule. Those numbers can move Treasury yields, the dollar and Fed expectations, and that matters for the whole commodity complex.
Thanksgiving follows on Thursday, so I’d be mindful of thinner trading later in the week. A big move in reduced liquidity doesn’t automatically mean a new long-term trend has started. What matters is what the data changes, what the market already expected and how price responds.
My view going into the new week
I think the oil market is giving us an important message. The geopolitical threat is real and the maritime security situation is serious, but the supply picture has changed a lot from the conditions that originally drove oil sharply higher. So I’m not going to blindly buy crude every time another attack hits the headlines. Equally, I’m not going to assume the downside is unlimited while such a significant shipping risk remains unresolved. A market can trend lower and still be vulnerable to a violent squeeze higher.
That’s why the next move needs to be judged against both the macro picture and the technical structure. I want to see where buyers and sellers actually respond. I want to know whether a recovery is driven by genuine supply deterioration or just short covering, and I want to know what would invalidate the view. The best analysis isn’t about being bullish or bearish forever. It’s about understanding why the conditions are changing.
Final thoughts: the next oil move won’t be explained by a headline alone
Oil tankers are being attacked, the Strait of Hormuz remains dangerous, and yet crude has fallen for three consecutive weeks. It sounds contradictory until you look underneath: recovering exports, changing supply expectations, weakening demand, barrels back on the water and a risk premium that is constantly being reassessed. That is the real story.
With US data on Wednesday and OPEC+ meeting the following Sunday, there’s no shortage of things to watch. The question isn’t whether the next headline sounds bullish or bearish. It’s whether that headline actually changes the balance between supply, demand and expectations. That’s what I’ll be watching as we head into the new week, and I’ll pick it up in tomorrow’s Week Ahead.
Ken
The KenMacro oil news and analysis hub collects every oil piece in one place, the Macro Regime Board tracks where each market sits, and the latest research is always on Macro Insights.
Frequently asked questions
Why is oil falling during the Iran war?
Recovering Gulf crude exports, weaker oil demand and expectations of a renewed supply surplus are offsetting part of the war risk premium. The IEA says world supply rose to 105.4 million barrels a day in October and expects a fourth-quarter surplus. Tanker attacks remain a serious threat and could reverse the outlook if they cause a lasting loss of supply.
What happened to oil prices on 20 November 2026?
Brent January futures settled at $92.57 and expiring December WTI futures at $83.98. Both rose on Friday after a tanker fire near the Strait of Hormuz, but both finished lower for a third consecutive week, with Brent down 3.41% and WTI down 5.17% on the week.
Have Gulf oil exports returned to pre-war levels?
Not fully. According to the IEA, Gulf crude flows reached 15 million barrels a day in October, 82% of pre-war levels, while total Gulf oil exports excluding Oman were 18.4 million barrels a day, still 26% below pre-war levels.
Why is the Strait of Hormuz important for oil prices?
It is the shipping route that connects the Persian Gulf producers with world markets, and before the war around a fifth of global oil consumption passed through it. Serious disruption can affect crude supply, freight and insurance costs, refined fuel availability and global inflation expectations.
Could oil prices rise sharply again?
Yes. A major sustained disruption to physical exports, an unexpected shift in producer policy or a meaningful pick-up in demand could support a sharp recovery. The size of the reaction would depend on what the market already expects and how big the change is.
When is the next OPEC+ meeting?
The seven OPEC+ producers that meet monthly are scheduled to meet on Sunday 29 November 2026, according to OPEC’s statement on their 1 November meeting. Reporting has framed it as a key decision point for 2027 production.
Does falling oil mean inflation will fall?
Lower oil can reduce some energy and transport-related inflation pressure, but the effect depends on how long the decline lasts, refined fuel prices, exchange rates and broader inflation trends. It does not guarantee lower interest rates on its own.
About the author: Ken Chigbo is a macro trader, educator and founder of KenMacro, with 18 years of financial markets experience and a background in City of London financial markets analysis.
The macro interpretations and conditional scenarios in this article are my own. This article is for educational and informational purposes only and does not constitute personalised investment advice. Trading involves risk, and past performance does not guarantee future results.
Get the macro framework the desk actually trades
The same regime-first framework behind every call on this site. Free. No spam, unsubscribe anytime.
Continue reading
From the desk
Where this gets traded
Oil reprices in violent, headline-driven gaps, and execution through a supply shock is the whole game. See the KenMacro desk guide to the best brokers for trading oil.
Read the desk guide →