
Gold Falls Again After CPI: The Dollar, Treasury Yields and My XAUUSD Short Explained
Why is gold falling again on 11 November 2026?
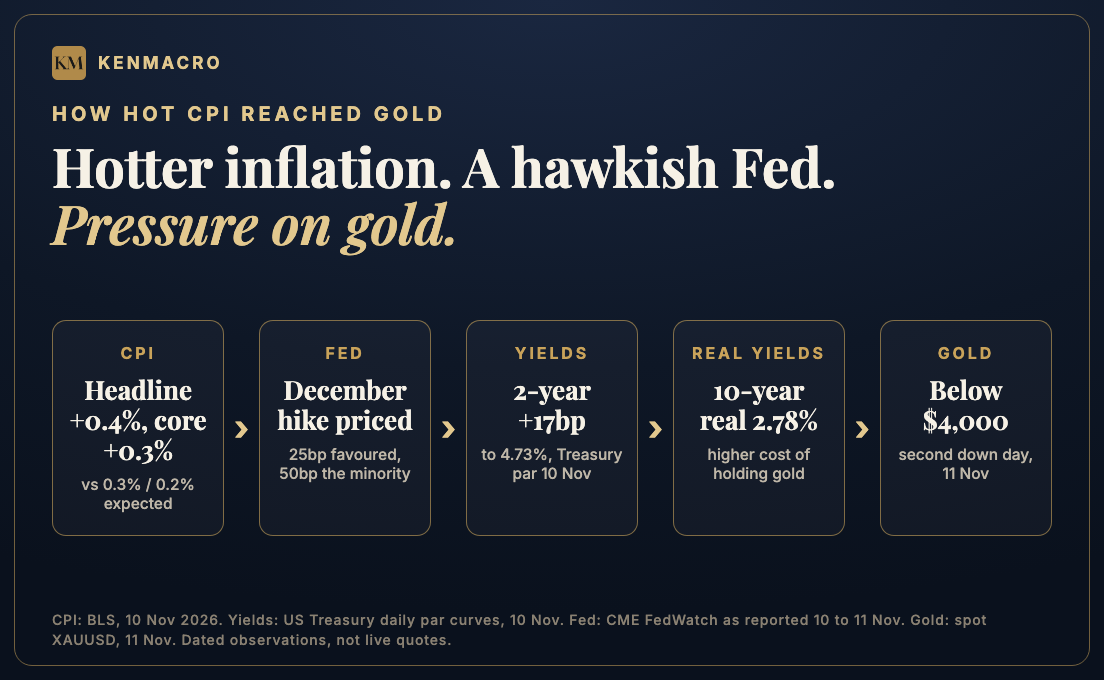
Gold has continued falling because the US inflation surprise strengthened the case for higher interest rates. The sequence runs like this: hotter inflation, more hawkish Fed expectations, higher Treasury yields, a stronger dollar and pressure on gold. That isn’t a relationship you can blindly trade every single time, but it explains why the market has treated this week’s CPI report so seriously.
On Tuesday, US headline CPI came in at 0.4% month on month against expectations of 0.3%, and core CPI, which excludes food and energy, rose 0.3% against forecasts of 0.2%. Headline inflation had actually slowed from September’s 0.6%. The problem was that it hadn’t slowed enough, and core was running at 0.3% for a third consecutive month.
So the market wasn’t celebrating slower inflation. It was reassessing how much further the Fed might need to tighten, and that reassessment hit gold.
Gold’s latest price action: the $4,000 area is back in focus
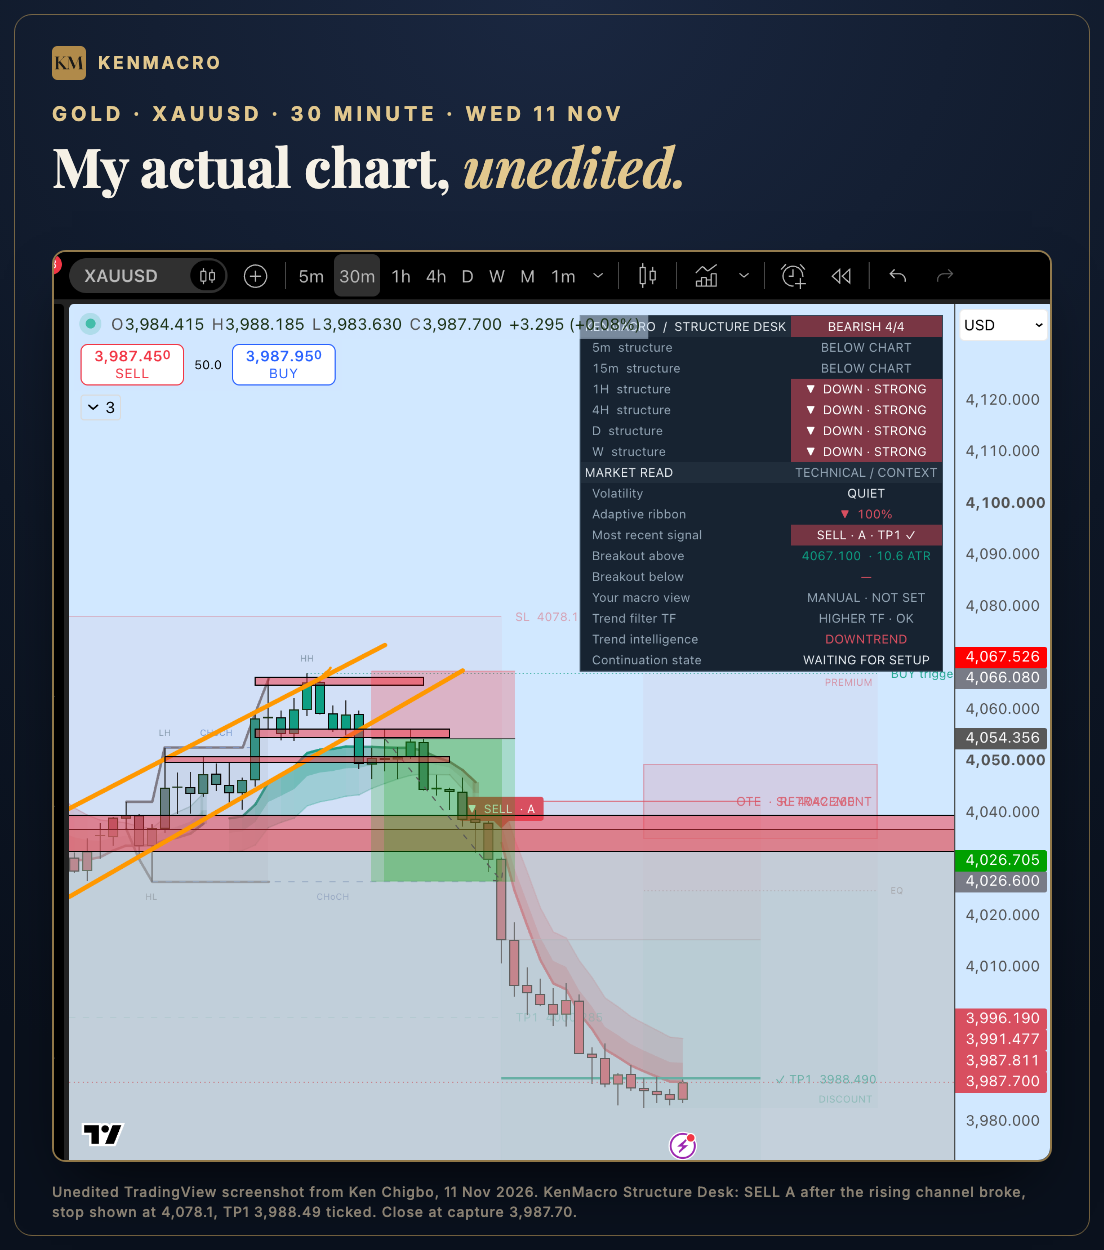
Monday’s recovery had given gold bulls something to work with, with price pushing above $4,140. Tuesday’s inflation-driven sell-off dragged it back to around $4,032, and Wednesday brought another test of the downside. On my own 30 minute XAUUSD chart, gold was at 3,987.70 when I captured it late on Wednesday.
Now we’re dealing with the $4,000 region again, and a major psychological level like that becomes a battleground between buyers defending the recovery and sellers pressing for continuation. But remember, a round number isn’t a trade signal. What matters is how price behaves around it: does gold recover $4,000 and hold, does a rebound get rejected, are sellers making fresh lows, and what are the dollar and real yields doing at the same time?
For the full CPI breakdown, including the initial reaction across bonds and FX, read my 10 November gold and inflation analysis.
The bond market was telling us something important
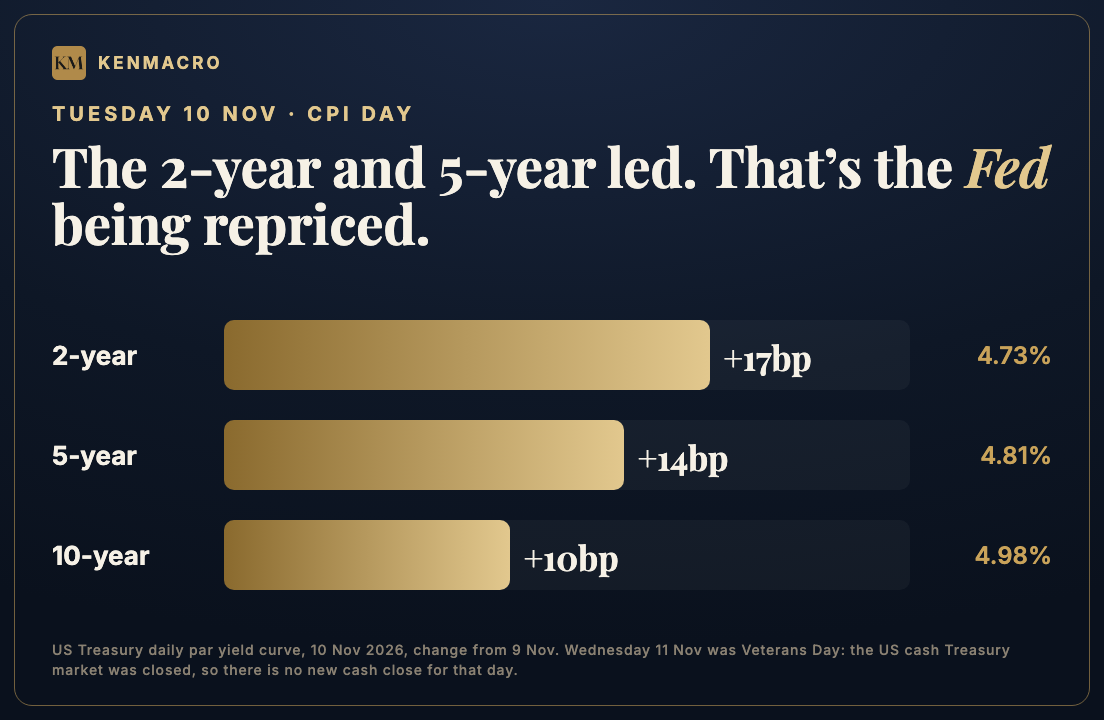
Look at what happened to US Treasury yields on Tuesday. These are the official Treasury par yield observations for 10 November, compared with the day before.
| Maturity | Yield | Daily change |
|---|---|---|
| 2-year | 4.73% | +17bp |
| 5-year | 4.81% | +14bp |
| 10-year | 4.98% | +10bp |
Notice where the biggest moves happened. The 2-year and 5-year led the repricing, and that’s exactly why I bring those maturities onto the screen during our live sessions. The 2-year is the part of the curve most sensitive to what the Fed is expected to do, and the 5-year captures a slightly longer view of that same rate path, so when the front end moves this aggressively I want to know what has changed in expectations. In this case, it was inflation and the Fed.
Remember, bond prices and yields move in opposite directions. When investors sell bonds, prices fall and yields rise. And one important distinction: Wednesday was Veterans Day, when the US cash Treasury market was closed, so the changes above are Tuesday’s cash-market observations, not a fresh Wednesday session.
Why higher real yields are a problem for gold
This is where I think a lot of traders miss the point. People hear that inflation is rising and immediately assume gold should rally, but gold doesn’t pay interest. If investors can suddenly earn more from interest-bearing assets, that changes the opportunity cost of holding something that pays no income.
With gold I pay particular attention to real yields, which are bond yields adjusted for inflation expectations. The US 10-year real yield rose to about 2.78% on 10 November, up from 2.63% on 6 November, so the inflation-adjusted return on holding US government bonds went up sharply in a matter of days. For non-yielding gold, that’s a substantial headwind.
Then add the currency side. Gold is priced in dollars, so when the dollar strengthens it becomes more expensive for buyers using other currencies, and the dollar firmed again on Wednesday. Higher real yields and a stronger dollar are a difficult combination for gold bulls. Not an impossible one, because gold can rally against both when physical demand, central bank buying or wider financial stress takes over, but you need to know which forces are actually driving the market. You can track the series on my real yields data page.
The Federal Reserve: why December matters
Before Tuesday’s inflation report, Fed Governor Christopher Waller had already given markets something to think about. He said he would support a 25 basis point hike in December even if inflation improved, and that if core CPI ran around 0.3% or higher, a larger 50 basis point increase should be considered. Core CPI arrived at 0.3%, so the report reinforced the hawkish argument.
By Wednesday, market pricing treated a December hike as close to certain. CME FedWatch figures reported on 10 and 11 November put a quarter-point move at roughly 85% to 89% and a half-point move at roughly 11% to 15%, so 25 basis points is still the most likely outcome. Those probabilities move with futures prices and shouldn’t be treated as fixed.
The broader point is simple. Markets are now debating the size of the next hike, not whether one is needed, and that has consequences for the dollar, bonds, gold and equities.
How I applied the macro view to an actual gold short
Now to the part that makes this more than another article about CPI. I took a manual short in gold during this selling pressure, and the KenMacro Structure Desk indicator produced a sell signal on the same market. I want to show you the actual evidence, because there’s a big difference between explaining a move afterwards and showing how a trading decision was built.
1. The macro backdrop
Before CPI, we were examining the risk that inflation could stay stubbornly high. Elevated energy prices were one reason for concern, alongside the persistence of core inflation and the Fed’s increasingly hawkish language. On my live session on Monday 9 November we worked through what a stronger-than-expected print would do to the dollar, bond yields and gold. That preparation mattered because a hot number could undermine the gold recovery. It was a scenario we needed to be ready to assess, not a guaranteed outcome.
2. Gold’s technical structure
Gold had been attempting a recovery after a liquidity sweep around the $4,000 area. On the weekly chart I’d called it a fake-out of the 4k liquidity, and the bullish argument was reasonable to monitor. But on the intraday chart the recovery was running into resistance with potential equal highs underneath it, and if buyers failed to sustain that push, the market was vulnerable to another leg lower.
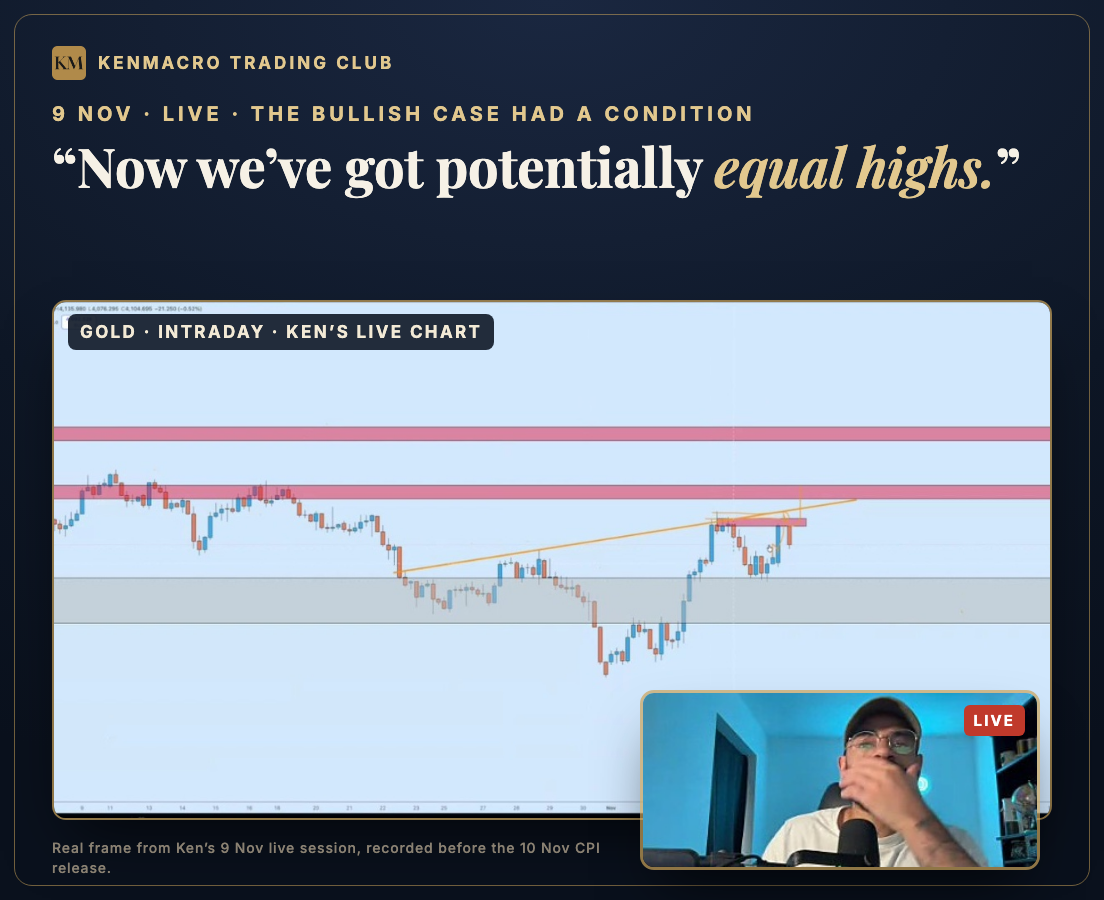
When the macro turned hostile to gold on Tuesday, those bearish technical possibilities became the live ones. On the 30 minute chart on Wednesday, price lost the rising channel it had been climbing in, broke down through the 4,026 to 4,040 zone, and kept making lower lows into the US afternoon.
3. The KenMacro Structure Desk indicator
This is where the indicator comes into the discussion. The Structure Desk printed a SELL A on the 30 minute chart after the channel broke, with its stop at 4,078.1 and its first target at 3,988.49, and that first target was hit. At the time of my screenshot the panel read Bearish 4/4: the 1 hour, 4 hour, daily and weekly structure all down, the adaptive ribbon fully bearish, and trend intelligence reading downtrend.
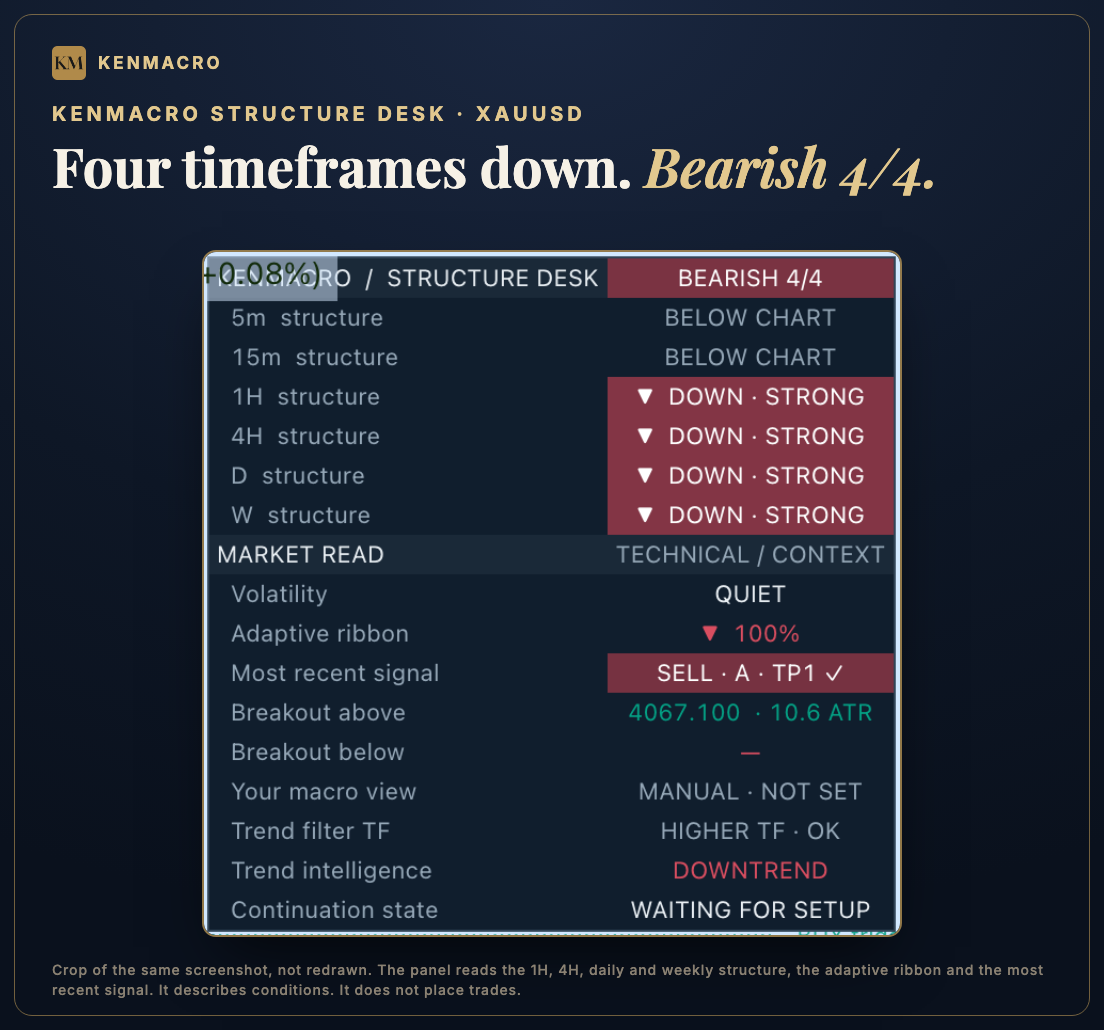
But that signal needs to be read alongside the price structure and the macro environment underneath it. An indicator can highlight a potential opportunity. It doesn’t know the future, and it doesn’t remove the need for risk management, which is why I want traders to understand why the conditions matter rather than blindly following a coloured arrow.
4. My manual short
I also entered a gold short manually. This was a separate trading decision that I placed myself, not an order executed by the indicator. The indicator reads structure and prints signals on the chart. It doesn’t place trades.
I’m not putting my fill or position size in an article, because the point here isn’t the result of one trade, it’s the process. What you can see is the chart exactly as I captured it: the signal, the stop it was working with, and the first target being hit as price pushed back below $4,000.
5. What made the idea valid, and what could have invalidated it?
Whatever the final result of any single trade, the important lesson is how the decision was put together. The macro provided the economic context, the technical structure identified the areas of interest, the indicator provided another piece of information, and risk management decided whether and how the opportunity could be traded at all.
The invalidation mattered just as much as the entry. If gold had reclaimed resistance and the macro pressure had started fading, the bearish argument would have needed reassessing, and on the indicator that line sits above 4,067. That’s not a weakness in a trading approach, it’s part of having one. I don’t want traders becoming dependent on somebody telling them when to buy or sell. I want them understanding the reasoning behind the decision.
What happens to gold next? Three scenarios I’m watching
I’m not interested in pretending the next move is guaranteed, so here’s how I’d approach the possibilities.
Scenario 1: gold continues lower
If the dollar stays strong, the rate outlook stays hawkish and gold can’t recover $4,000, sellers keep control. Another failed rally into resistance would reinforce the downside case, and a sustained breakdown would make the next confirmed support and any lower-low structure the levels that matter.
Scenario 2: gold recovers the $4,000 region
The bearish case gets less convincing if gold reclaims $4,000, starts building higher lows and shows sellers losing control. I’d also want to see the dollar and rate expectations softening, because reclaiming the level alone isn’t enough. The structure and the wider conditions have to agree.
Scenario 3: the bigger bullish setup returns
The broader bullish thesis hasn’t disappeared. Before CPI, the recovery case pointed back towards the liquidity around $4,200, but that was always conditional on confirmation. After this sell-off gold would need to rebuild that case with a stronger technical reversal, improving momentum and a more supportive macro backdrop, so until then the upside levels are scenarios, not destinations. You can follow the evolving picture on my gold price forecast desk.
Five things I’d check before trading the next gold sell-off
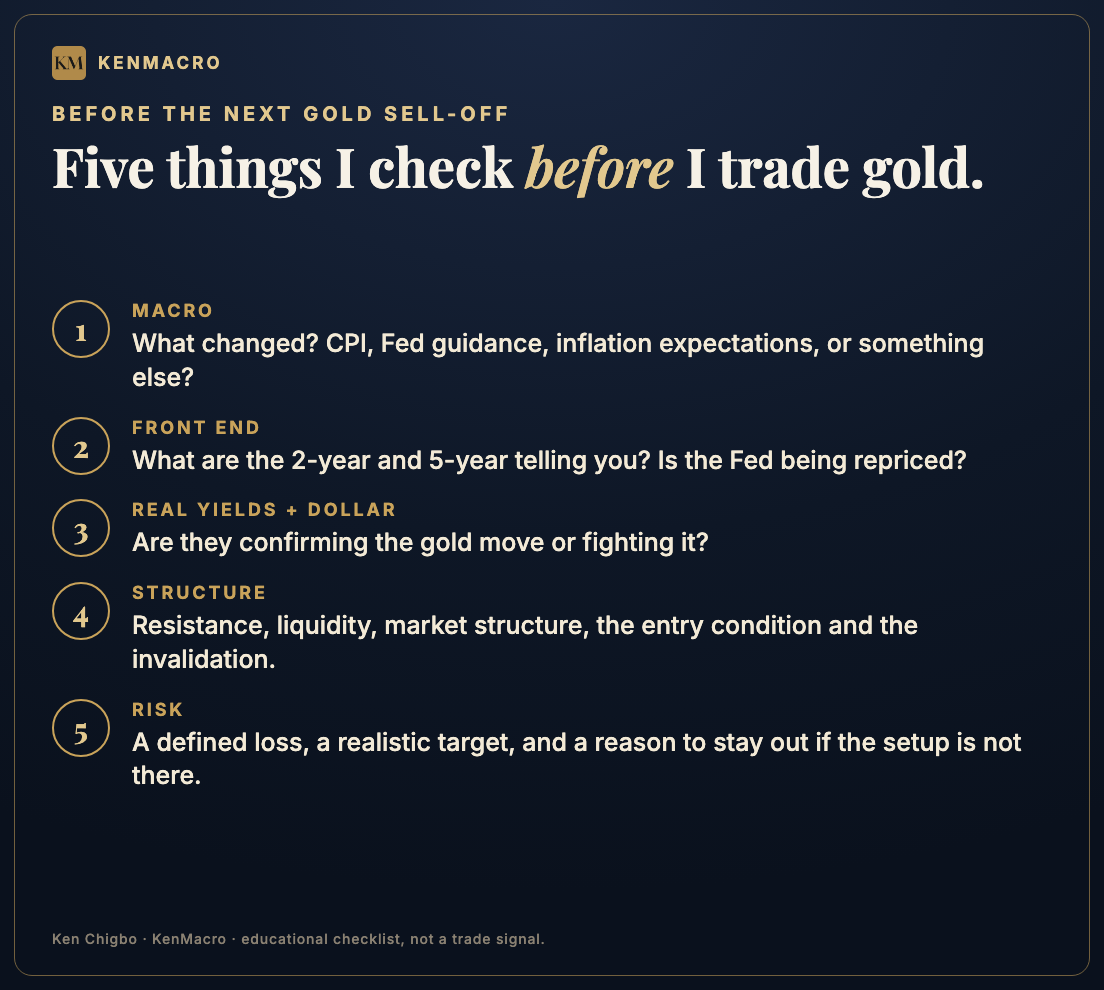
- What’s changed in the macro? CPI, Fed guidance, inflation expectations or something else?
- What are the 2-year and 5-year telling us? Is the market repricing the Fed?
- What are real yields and the dollar doing? Are they confirming or contradicting the gold move?
- Where’s the technical structure? Resistance, liquidity, market structure, entry conditions and invalidation.
- Does the risk make sense? A defined loss, realistic targets and a reason to stay out if the setup isn’t there.
That’s the checklist. It isn’t complicated, but it forces you to think beyond the last candle. If you want the event side of it, my guide on how to trade CPI walks through the release itself.
Why I teach macro and technicals together
I’ve spent 18 years studying and trading financial markets, and the longer I’ve done this, the less interested I’ve become in pretending there’s some magical indicator that gets everything right. There isn’t. The real work is understanding what moves markets, where price offers opportunities, and how to manage the risk when you’re wrong.
Inside the KenMacro Trading Club I work through the markets live every weekday. I explain the economic developments I’m watching, why they matter, what I’m seeing on the charts and what would make me change my view, and you see the practical tools I use, including the Structure Desk. I share the process because I want people to understand how the pieces fit together, not just copy a trade.
Today’s gold sell-off is a perfect example. The CPI report mattered, the Fed’s reaction mattered, the bond market mattered and the dollar mattered, and then we had to apply all of it to the chart. If you’ve been watching moves like this and wondering how to make sense of everything happening at once, come and learn with me.
Ken Chigbo
Follow-up, 17 November: gold is still under pressure even as Iran tensions escalate. Read why gold is falling despite the Iran war, with retail sales, real yields near 3% and the Fed outlook.
Frequently asked questions
Why did gold fall again on 11 November 2026?
Gold kept falling after Tuesday’s hotter-than-expected US CPI report raised expectations of tighter Fed policy. Higher Treasury yields, a 10-year real yield near 2.78% and a stronger dollar put pressure on non-yielding bullion, and spot gold slipped back below $4,000.
Why do higher Treasury yields hurt gold?
Gold pays no interest. When bond yields, and particularly real yields, rise, interest-bearing assets become relatively more attractive and the opportunity cost of holding gold goes up. The relationship isn’t automatic, but it was clearly in play this week.
What was US CPI in October 2026?
Headline CPI rose 0.4% month on month and core CPI rose 0.3%, both 0.1 percentage point above consensus. The Bureau of Labor Statistics published the figures on 10 November 2026.
What happened to US bond yields after CPI?
On 10 November the 2-year Treasury par yield rose 17 basis points to 4.73%, the 5-year rose 14 basis points to 4.81% and the 10-year rose 10 basis points to 4.98%. The front end moved most because it is the most sensitive to Fed expectations.
Did Treasury yields rise again on Veterans Day?
The US cash Treasury market was closed for Veterans Day on Wednesday 11 November, so there was no new cash close. The yield changes quoted here are from Tuesday’s regular session.
Did the KenMacro Structure Desk indicator execute the gold short?
No. The indicator printed a SELL A signal on the 30 minute chart, and the manual short was a separate decision placed by Ken. The indicator reads structure and shows signals. It doesn’t place trades.
Can gold recover after the CPI sell-off?
Yes. Gold could recover if buyers reclaim $4,000 and build higher lows while the dollar and rate expectations soften. A sustained recovery needs that confirmation rather than an assumption that the market has bottomed.
Get the macro framework the desk actually trades
The same regime-first framework behind every call on this site. Free. No spam, unsubscribe anytime.
Continue reading
From the desk
Part of the Gold Forecast hub, the desk’s living guide, kept current as markets move.
Where this gets traded
If you trade gold (XAU/USD) around real-yield shifts, CPI or FOMC, execution quality decides the fill. See the KenMacro desk guide to the best brokers for trading gold.
Read the desk guide →