
Why Is Gold Falling Despite the Iran War? US Dollar, Oil and Fed Outlook
The market in 60 seconds
- The USS Theodore Roosevelt entered the Middle East on 15 November, giving the US three carrier strike groups in the region.
- Iran claimed a drone strike on a US radar at Bahrain’s Sheikh Isa Air Base on 17 November, its third claimed attack on US targets in Bahrain in under a week. US Central Command said the drones were intercepted.
- Iranian officials said US attacks hit Qeshm Island on 17 November. The US has not confirmed it.
- US retail sales rose 0.2% in October, with sales excluding autos and the control group both up 0.6%.
- US import prices rose 1.1% in October.
- The 10-year Treasury real yield was 2.92% on 16 November, and markets are pricing a December Fed hike.
- Spot gold is trading well below $4,000, around $3,850 to $3,880 during Tuesday’s US session.
- Brent fell sharply on Monday, then rebounded to around $93.5 on Tuesday as Iran headlines returned.
- Nvidia earnings after Tuesday’s US close and Wednesday’s Fed minutes are the next big catalysts.
Trump said the Iran war was effectively over. What has changed?
On 9 November, after meeting Qatar’s prime minister, President Donald Trump said the war with Iran was “militarily effectively over” (Al Jazeera). Iran dismissed that, and the developments since suggest the risks are far from resolved.
The USS Theodore Roosevelt Carrier Strike Group entered the US 5th Fleet area on Sunday 15 November, joining the George H.W. Bush and George Washington groups and taking the number of American carrier strike groups in the region to three (USNI News). On Tuesday 17 November, Iran’s Revolutionary Guard claimed a drone strike on a US radar at Bahrain’s Sheikh Isa Air Base, its third claimed attack on US targets in Bahrain in under a week. US Central Command called the claim false and said several drones were intercepted with no damage or injuries (CBS News).
Iranian officials also said US attacks hit Qeshm Island, near the Strait of Hormuz, on Tuesday. That remains reported rather than confirmed, as the US has not confirmed a strike. Iran has also claimed tankers hit mines near Hormuz, which the US disputes, while Qatar says mediation is continuing.
For financial markets the key question isn’t the headline count. It’s whether renewed hostilities threaten energy supply, because that is where the geopolitical story becomes the macro story. More carriers in the region don’t necessarily mean another major offensive is coming, but they do keep the risk premium alive.
Why is the US dollar still strong?
The bigger story of the last few weeks has been how resilient the US economy looks. Despite elevated borrowing costs, the war and sticky inflation, the data keeps coming in solid, and a resilient economy gives the Fed room to keep tightening rather than worry about growth. That is the backdrop the dollar is trading on.
| Indicator | Latest reading |
|---|---|
| Q3 2026 real GDP, annualised (advance estimate) | +3.4% |
| October nonfarm payrolls | +165,000 |
| October unemployment rate | 4.1% |
| October average hourly earnings, monthly | +0.4% |
| October headline CPI, monthly | +0.4% |
| October core CPI, monthly | +0.3% |
| October retail sales, monthly | +0.2% |
| October retail sales excluding autos | +0.6% |
| October import prices, monthly | +1.1% |
Sources are listed at the end of the article. If inflation stays elevated while activity holds up, the argument for further tightening gets stronger, not weaker. On my live session this afternoon the Dollar Index was pushing into the gap it left in 2025 around 103, in a clean staircase of higher highs and higher lows on the four hour chart, which tells you the dollar trend is still intact even if it is meeting friction there.
US retail sales: the number beneath the headline
Headline retail sales rose 0.2% in October, in line with consensus and down from September’s 0.8%. At first glance that reads like a consumer losing momentum. Look underneath and it’s a different story: sales excluding autos rose 0.6% against 0.4% expected, and the control group, which feeds into the consumer spending estimate in GDP, also rose 0.6% against 0.4% expected.
So motor vehicles dragged the headline while spending across most other categories held up well. One caveat matters here: retail sales are measured in nominal terms, so they are not adjusted for inflation, and stronger sales don’t necessarily mean people are buying more stuff. Even so, this was not a report showing a collapsing consumer, and with import prices up 1.1% in the month against 0.7% expected, you can see why inflation is still the conversation.
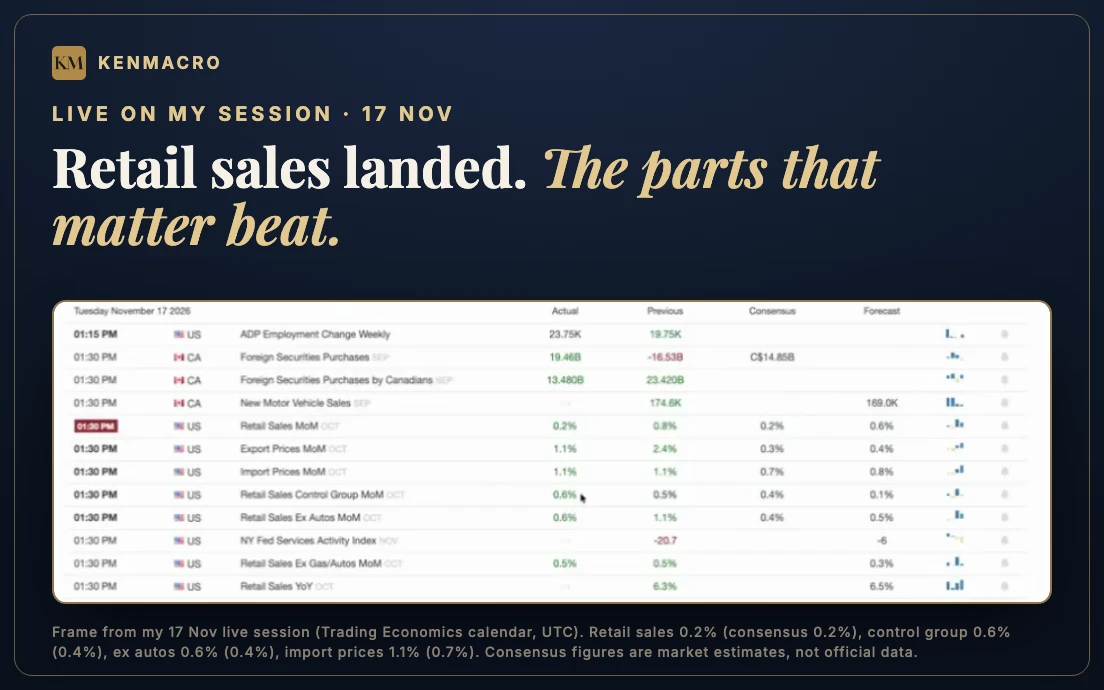
This is also why I wasn’t surprised by it. Before the release we had strong GDP, solid jobs, firm wages and low unemployment, and basic macro logic says that combination tends to show up in spending. We built the case before the number, so when it landed we were prepared rather than reacting.
Why gold is falling despite geopolitical escalation
Gold doesn’t pay interest. When inflation-adjusted government bond yields rise, interest-bearing assets become relatively more attractive than gold, and that is what traders mean by the opportunity cost of holding it. The official US Treasury figures show why that cost is high right now.
| Maturity | Yield |
|---|---|
| 2-year | 4.83% |
| 5-year | 4.93% |
| 10-year | 5.12% |
| 30-year | 5.46% |
| 10-year real (inflation-adjusted) | 2.92% |
Official Treasury par yield curve and real yield curve data for 16 November, the latest posted at the time of writing.
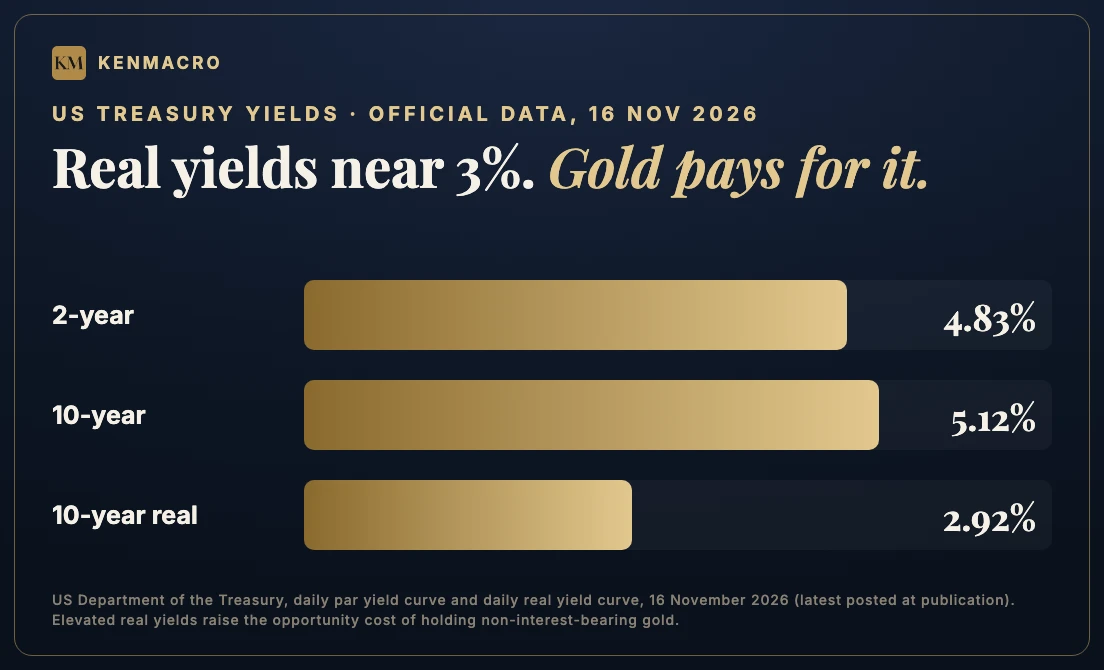
Put elevated real yields, a firm dollar and expectations of further Fed tightening together and you have a tough environment for precious metals. Gold can still attract safe-haven demand during military escalation, but that demand is competing with some powerful macro forces. War can increase demand for gold, and it can also create the inflation that makes the monetary backdrop worse for gold. Both mechanisms exist at the same time, and the question is which one dominates.
Today the answer was clear on my screen. With yields still pricing hikes, gold should typically be capped on the upside, and it shouldn’t fly while yields climb unless yields roll over. I went through the full relationship in my earlier piece, why gold falls during war: oil, Treasury yields and the dollar, and you can track the series on my real yields data page.
How rising oil prices could complicate the gold outlook
Oil is one of the most important variables I’m watching right now. Despite the weekend’s escalation, Brent fell sharply on Monday as the market leaned towards a better supplied picture, then rebounded to around $93.5 on Tuesday, with an intraday high near $93.8, as the Iran headlines returned (market report). On my session, oil was pushing higher off a double bottom while US and Iran tensions escalated.
The significance isn’t simply that oil can rise during a war. It’s what a sustained rise in oil means for inflation, for the Fed and then for every other market. The chain runs from renewed escalation to energy supply risk, then higher oil, extra inflation pressure, more hawkish Fed expectations, higher real yields and a firmer dollar, and finally pressure on gold and equities.
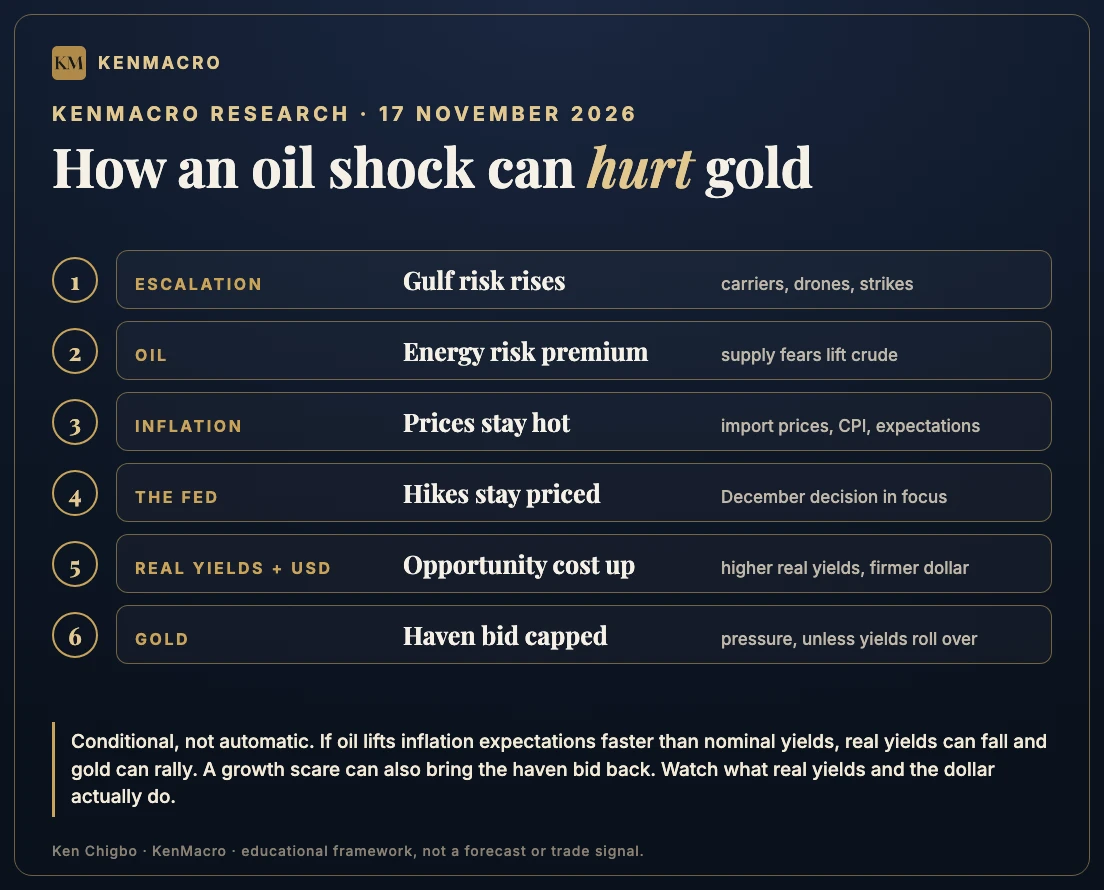
That chain is conditional, not automatic. Higher inflation expectations could actually lower real yields if nominal yields fail to keep pace, and a severe shock could trigger a growth scare that brings real haven demand back into gold. That’s why I watch the actual market reaction instead of assuming every military headline produces the same outcome.
What I’m watching on the gold chart
Gold was broadly flat going into the data, then broke lower after it. On the 15 minute chart the rising trendline gave way, and with the dollar strong and yields supported, I’m treating that as a market that wants lower rather than one that has bottomed. My process doesn’t change: I want the break of the Asian range low area, a retest and a rejection before I’d consider a short, and if that retest never comes, I don’t trade.
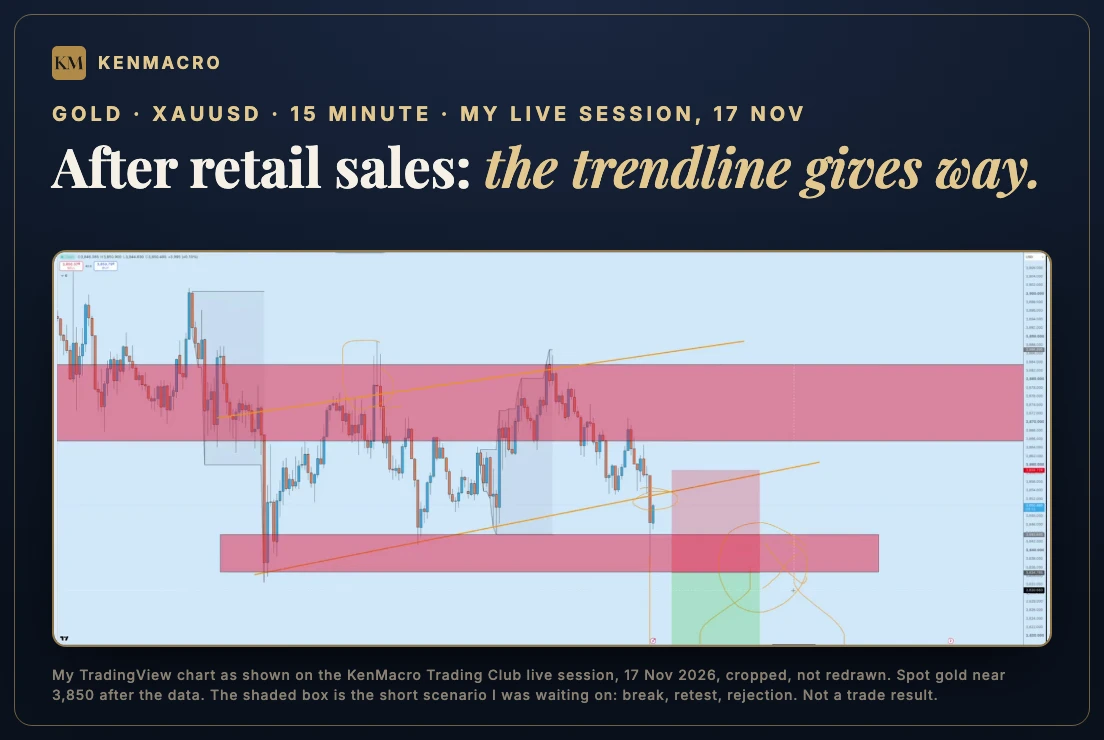
Round numbers below, starting with 3,800, are the obvious areas of liquidity on my watch list if the move continues. A cheaper asset is not automatically a buying opportunity: the conditions that drove the sell-off need to change first, and for gold that means real yields and the dollar rolling over, followed by price building higher highs and higher lows.
What does this mean for the Nasdaq and tech stocks?
The same forces hitting gold matter for equities. The Nasdaq Composite fell 2.49% on Monday 16 November to 24,509.76, and the S&P 500 lost 1.92% (market close report). Nvidia reports after Tuesday’s US close, another big test of confidence in the AI investment cycle, and strong numbers may not deliver a lasting rally if investors are worried about rates at the same time. Better than expected earnings alongside falling yields would be a different story.
Higher discount rates reduce the present value of future earnings, and growth companies whose valuations lean heavily on future profits feel that most. On my session the Nasdaq was showing the same price action as gold: equal highs, a retest and selling. I’m watching two scenarios there, a retest of the upper range for shorts, or a break of the range, a retest and continuation.
Fed minutes and the December decision: what I’m watching
The minutes of the Fed’s 27 to 28 October meeting are due on Wednesday 18 November at 19:00 GMT. At that meeting the Fed held rates at 3.75% to 4.00%, with two dissents in favour of a 25 basis point hike, after hiking in September (Federal Reserve). Markets now price a December hike at roughly 90% to 100%, with a small chance of 50 basis points. Remember that the minutes reflect October’s discussion, so they predate November’s jobs and inflation figures. The market’s reaction will depend on whether that earlier debate challenges or reinforces what is already priced.
The questions I’ll be asking of them:
- How worried were policymakers about persistent inflation?
- How much disagreement was there over the path of rates?
- Are they more concerned about energy-driven inflation or economic weakness?
- Is there anything that could change expectations for December and beyond?
There’s one more lesson I gave members today that a lot of traders get wrong. If a 25 basis point hike on 9 December is fully priced and the Fed delivers only that, the first reaction can be a weaker dollar and a bounce in gold, because markets buy the anticipation and sell the fact. Know what is priced, and you won’t be confused when it happens.
My gold, dollar and oil roadmap
I’m approaching this environment through three conditional scenarios. These are scenarios, not predictions or trade recommendations, and I want the macro narrative confirmed by price action before acting on any of them.
| Macro scenario | Potential market implications |
|---|---|
| Oil rises materially, real yields climb and Fed pricing turns more hawkish | Dollar supported; gold and tech stocks vulnerable |
| Energy prices stabilise, inflation worries ease and yields retreat | Dollar potentially weaker; room for relief in gold and equities |
| Major escalation triggers global risk-off and a growth scare | Gold may attract haven demand; equities vulnerable; dollar and yields need confirmation |
This is what I was teaching before the gold sell-off
On my live session on Monday 9 November, the day before CPI, we were working through the risk of a hotter-than-expected inflation print and what it would mean for gold. The next day inflation came in above expectations and gold came under heavy pressure. I then documented how I combined that macro view with the chart, including a manual gold short and a sell signal from my KenMacro Structure Desk indicator.
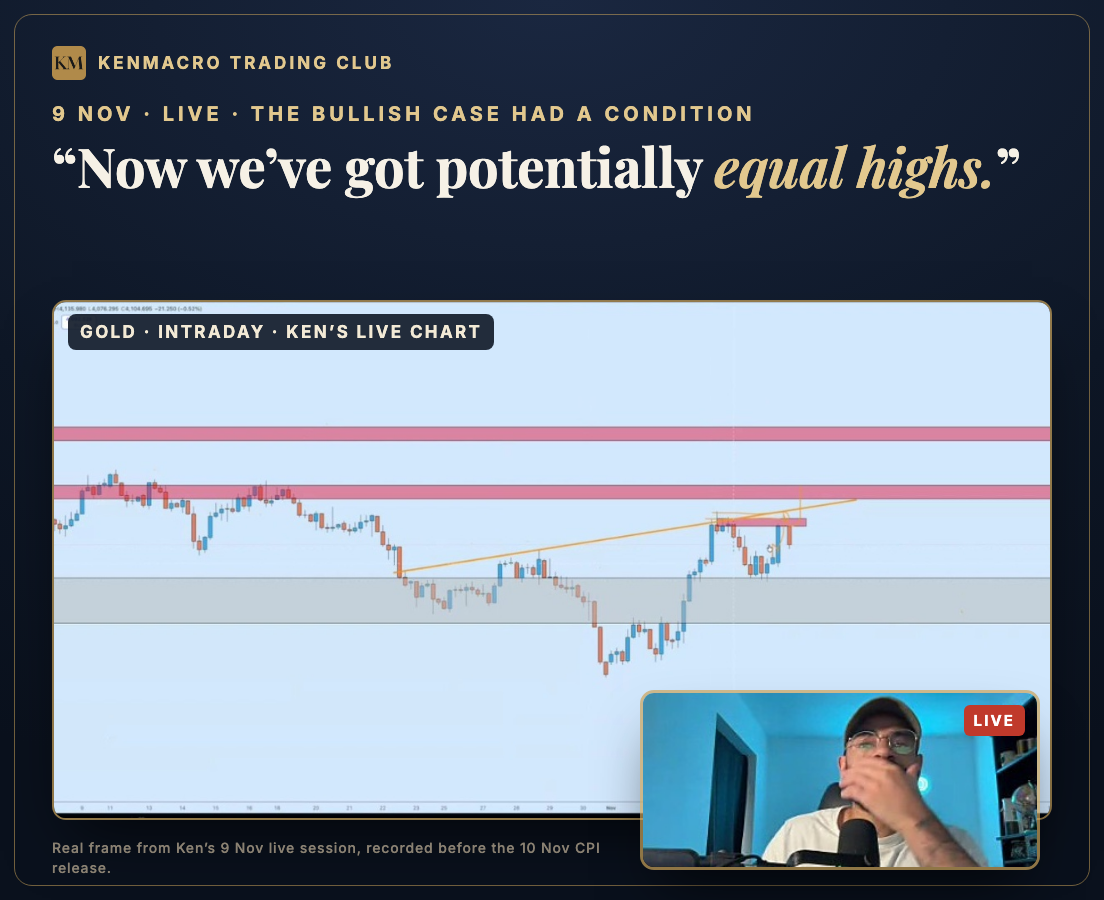
You can read the full breakdown in how I approached the gold sell-off after US CPI, and the macro side in why gold fell after the hot CPI report. The point isn’t one trade. It’s the process of identifying a scenario, understanding why it matters, waiting for technical confirmation and managing the risk if the market does something different, and that is a process traders can learn.
Understand what is moving the market before your next trade
I’ve spent 18 years in financial markets, including time on a financial markets news desk in the City of London. One of the biggest problems I see with retail traders is that they look at a chart without understanding the environment that chart is moving in. They see gold falling during a war and assume the market is wrong, they see inflation rising and assume gold must rise, and they see the Nasdaq falling and immediately start hunting for buying opportunities.
But what are rate expectations doing? What are real yields doing, what is the dollar doing, and what has the market already priced in? Those are the conversations we have inside the KenMacro Trading Club every weekday. I take you through the live markets, my macro analysis, the technical structures I’m watching and how I build trading scenarios, with recordings of every session and a community focused on actually understanding markets. See my macro week ahead for the rest of this week’s catalysts.
Ken Chigbo
Frequently asked questions
Why is gold falling despite the Iran war?
Safe-haven demand is competing with high US real yields, a firm dollar and expectations of another Federal Reserve rate hike in December. Gold pays no interest, so a 10-year real yield near 3% raises the cost of holding it. Geopolitical escalation does not guarantee higher gold prices.
Why is the US dollar strong in November 2026?
The dollar is supported by resilient US economic data, sticky inflation and a market pricing further Fed tightening. Strong October jobs, CPI and retail sales data have kept rate expectations high relative to other major economies.
Does rising oil make gold go up or down?
It can do either. Rising oil can support gold through inflation hedging and safe-haven demand, but oil-driven inflation can also push up rate expectations and real yields, which weighs on gold. The response depends on what real yields and the dollar do.
What were the latest US retail sales figures?
US retail sales rose 0.2% month on month in October 2026, according to the release on 17 November, in line with consensus. Sales excluding autos and the control group both rose 0.6%, ahead of the 0.4% expected.
How many US aircraft carriers are in the Middle East?
Three. The USS Theodore Roosevelt entered the US 5th Fleet area on 15 November 2026, joining the George H.W. Bush and George Washington carrier strike groups, according to USNI News.
When are the next Federal Reserve minutes released?
The minutes of the 27 to 28 October 2026 FOMC meeting are scheduled for release at 2pm Eastern, 19:00 GMT, on Wednesday 18 November 2026. The next Fed rate decision is on 9 December.
Is now a good time to buy gold?
A fall in price alone does not make a buying opportunity. Gold’s direction still depends on rate expectations, real yields, the dollar, geopolitics and technical structure. I want to see real yields and the dollar roll over and price build higher highs and higher lows first.
About the author: Ken Chigbo is a macro trader, educator and founder of KenMacro, with 18 years of financial markets experience and a background in City of London financial markets analysis.
This article is for educational and informational purposes only and does not constitute personalised investment advice. Trading involves risk, and past performance does not guarantee future results.
Get the macro framework the desk actually trades
The same regime-first framework behind every call on this site. Free. No spam, unsubscribe anytime.
Continue reading
From the desk
Part of the Gold Forecast hub, the desk’s living guide, kept current as markets move.
Where this gets traded
If you trade gold (XAU/USD) around real-yield shifts, CPI or FOMC, execution quality decides the fill. See the KenMacro desk guide to the best brokers for trading gold.
Read the desk guide →