
Oil Is Crashing. Democrats Have Won Congress. Is the Inflation Trade Finally Turning?
Why are oil prices falling today?
Let’s start with the politics, because that’s what changed overnight. The Associated Press has called both chambers of Congress for the Democrats. The new Congress takes its seats in January, so nothing changes in Washington tomorrow, but the political calculation around the war has changed immediately.
The White House is drawing the connection itself. Trump told Fox News “I think it’s the gasoline price” when asked about the defeat, and JD Vance wrote on X that “any honest conversation about where we go from here must start there.” Chuck Schumer went further: “We will end the war.” Then Trump told the Financial Times the US had no immediate plans to strike Iran.
Think about what that means for an oil trader. For months crude has carried a premium for the risk of more strikes, more attacks on shipping and more damage to Gulf infrastructure. When the people running the war start blaming it for an election defeat, the market assumes the appetite for escalation has dropped, and it reprices fast.
The weekly supply data didn’t stop it either. The EIA reported a crude draw of 865,000 barrels in the week to 30 October, taking commercial stocks to 409.8 million barrels. On a normal day a draw supports prices. Today nobody cared, which tells you this was a geopolitical repricing, not an inventory story.
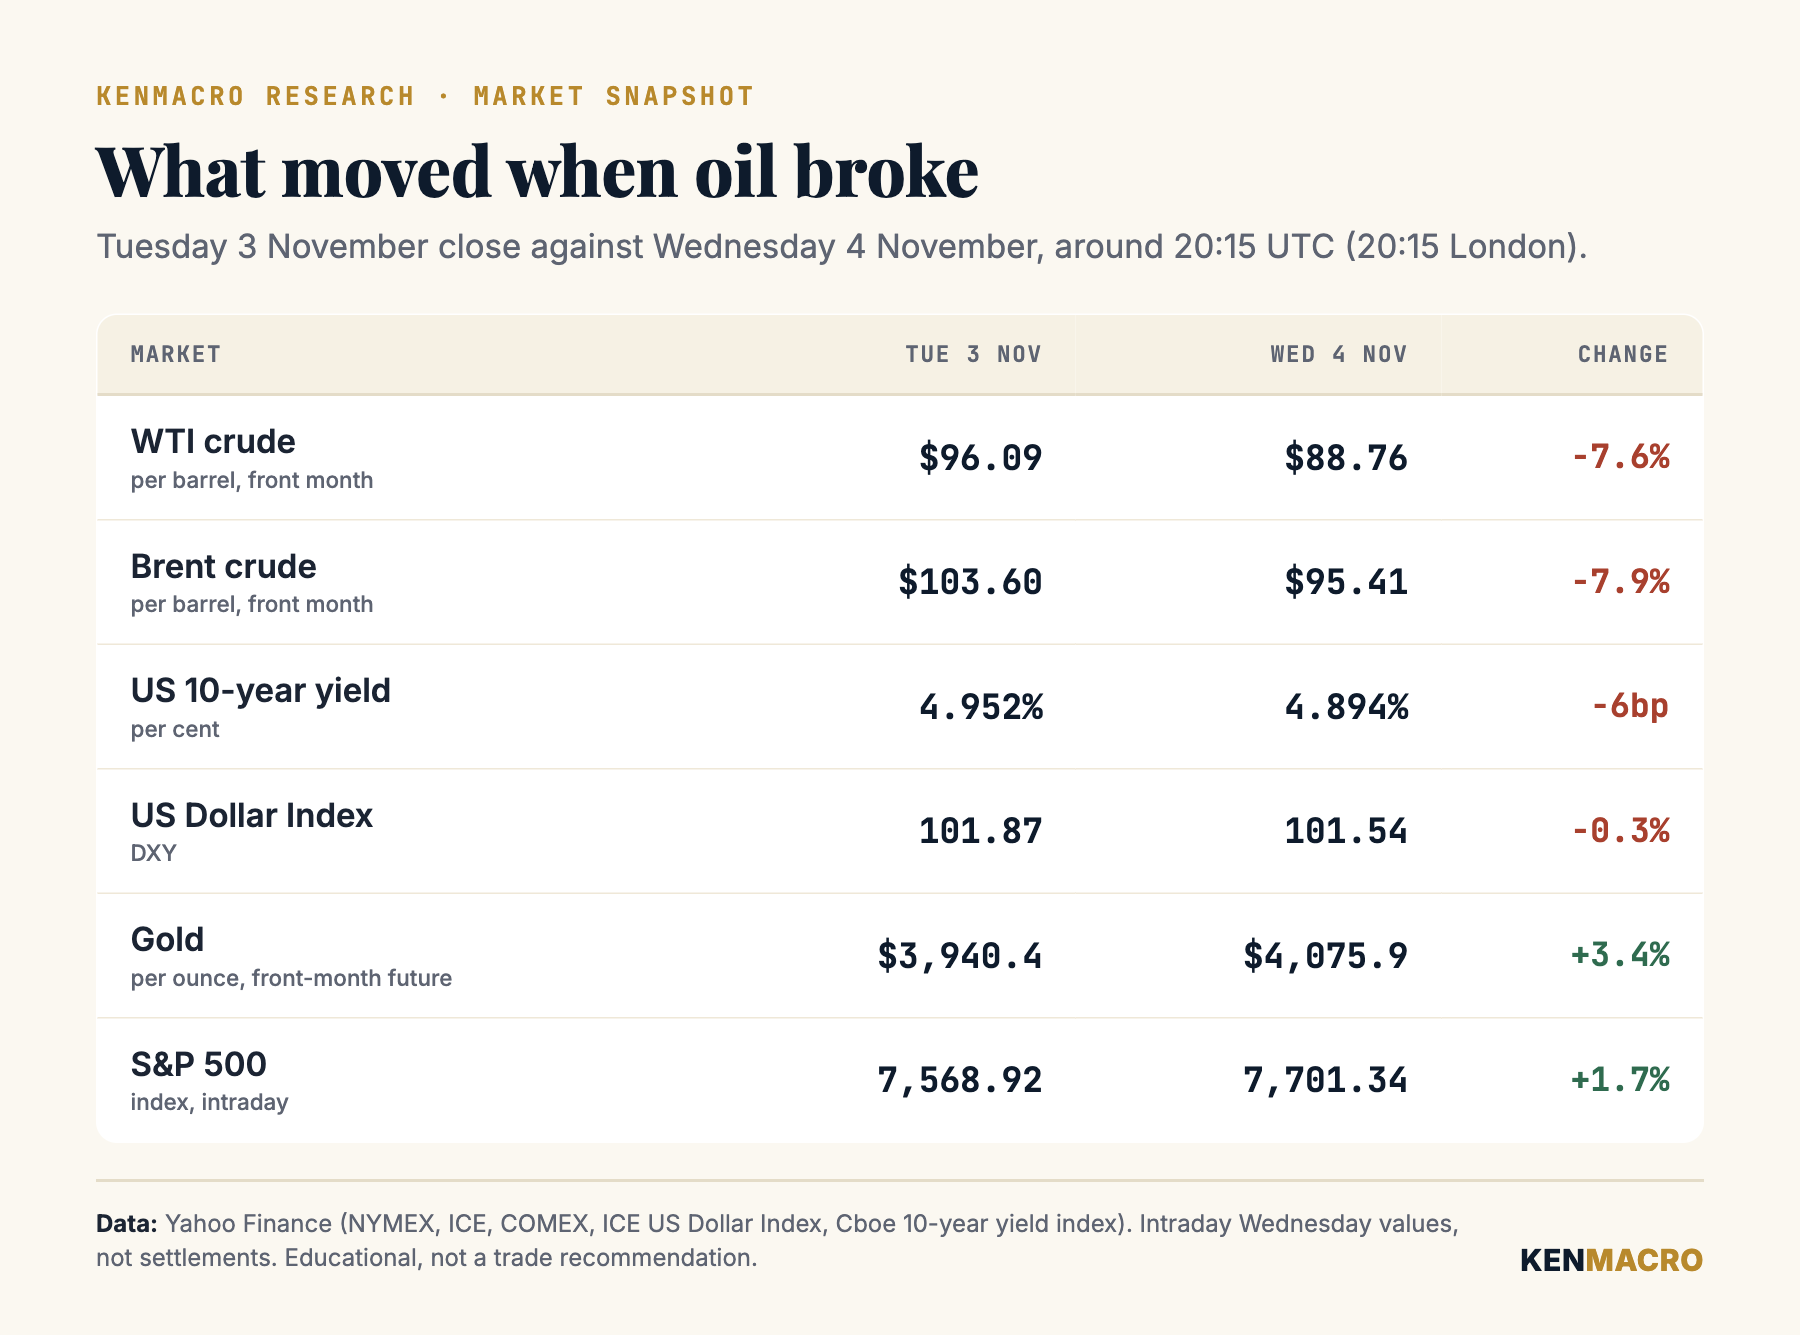
Iran, Qatar and the disappearing war premium
The diplomacy is real, but it isn’t finished. Qatar has stepped up its mediation, and Qatari mediators travelled to Tehran on Monday evening for talks with Iran’s foreign minister. But a senior Iranian official said on Tuesday that the two sides remain far from a deal, and Iran’s Supreme Leader said in a written statement that US hostility would continue regardless of which party was in power.
That’s the distinction I want you to hold onto. A reduction in the fear of escalation is not the same thing as a peace agreement. Gulf crude exports actually fell in October, to 17.1 million barrels a day from 18.9 million in September according to Vortexa data, and damaged infrastructure and insurance costs don’t disappear because negotiations sound better.
So the market is doing what markets always do. It’s pricing the probability shift now, before the evidence arrives. That can be right, and it can also overshoot badly if talks stall.
What the Democratic sweep does and doesn’t change
I’ve seen a lot of lazy takes today, so let’s be precise. A Democratic Congress makes new tax cuts and big fiscal packages much harder to pass, and it puts the war under far more scrutiny. That’s the part the market is pricing.
What it doesn’t do is switch off tariffs. Most of the tariff regime runs through executive authority, and reversing it over a presidential veto needs two-thirds majorities the Democrats don’t have. Josh Lipsky at the Atlantic Council put it bluntly: “Tariffs, meanwhile, are not likely to change.”
And Democrats aren’t automatically disinflationary either. They will want their own spending priorities in any deal. What’s changed is the probability of some of the inflationary outcomes the market had been pricing, and markets reprice expectations long before policy actually changes.
Why the oil sell-off matters for inflation and the Fed
This is where the story becomes much bigger than crude. Oil feeds into petrol, diesel, freight and the cost of moving almost everything, and businesses either absorb those costs or pass them on. When oil falls this hard, energy inflation pressure eases, inflation expectations can come down, and the case for more Fed tightening gets weaker.
Remember where the Fed actually is. It hiked in September for the first time since 2023, taking rates to 3.75% to 4.00%, and held in October with Lisa Cook and Beth Hammack dissenting in favour of another hike. The next decision is 8 and 9 December.
Here’s the contradiction I find most interesting. Oil collapsed today and the chance of a December hike didn’t fall at all. CME FedWatch had it at roughly 79% on Wednesday, slightly higher than Tuesday’s 77%, as reported by ActionForex. The bond market moved, with the 10-year yield down about 6 basis points to 4.89%, but the front end is still saying December is coming.
That makes sense when you look at the data. ADP showed 86,000 private jobs in October, a touch above expectations. ISM services came in at 54.5, and its prices index eased to 73.0 from 74.0, which is still very high. The Fed needs evidence that lower oil is feeding through to core inflation, and October CPI on Tuesday 10 November is the first real test.
So I’d frame it like this. Lower oil makes a second hike after December less likely. It doesn’t yet cancel December, and the market could easily be pricing out inflation risk long before the data confirms it.
WTI technical analysis: the $105 supply zone and the $88 neckline
Now let’s bring the chart in, because this is where the macro and the price action start lining up. On the daily WTI chart, price has failed twice in the same supply zone. The first high was $106.75 on 15 September, the second was $104.99 last Friday, and in between there was a spike to $110.48 on 20 October that closed back at $101.79, which was the November contract’s expiry day.
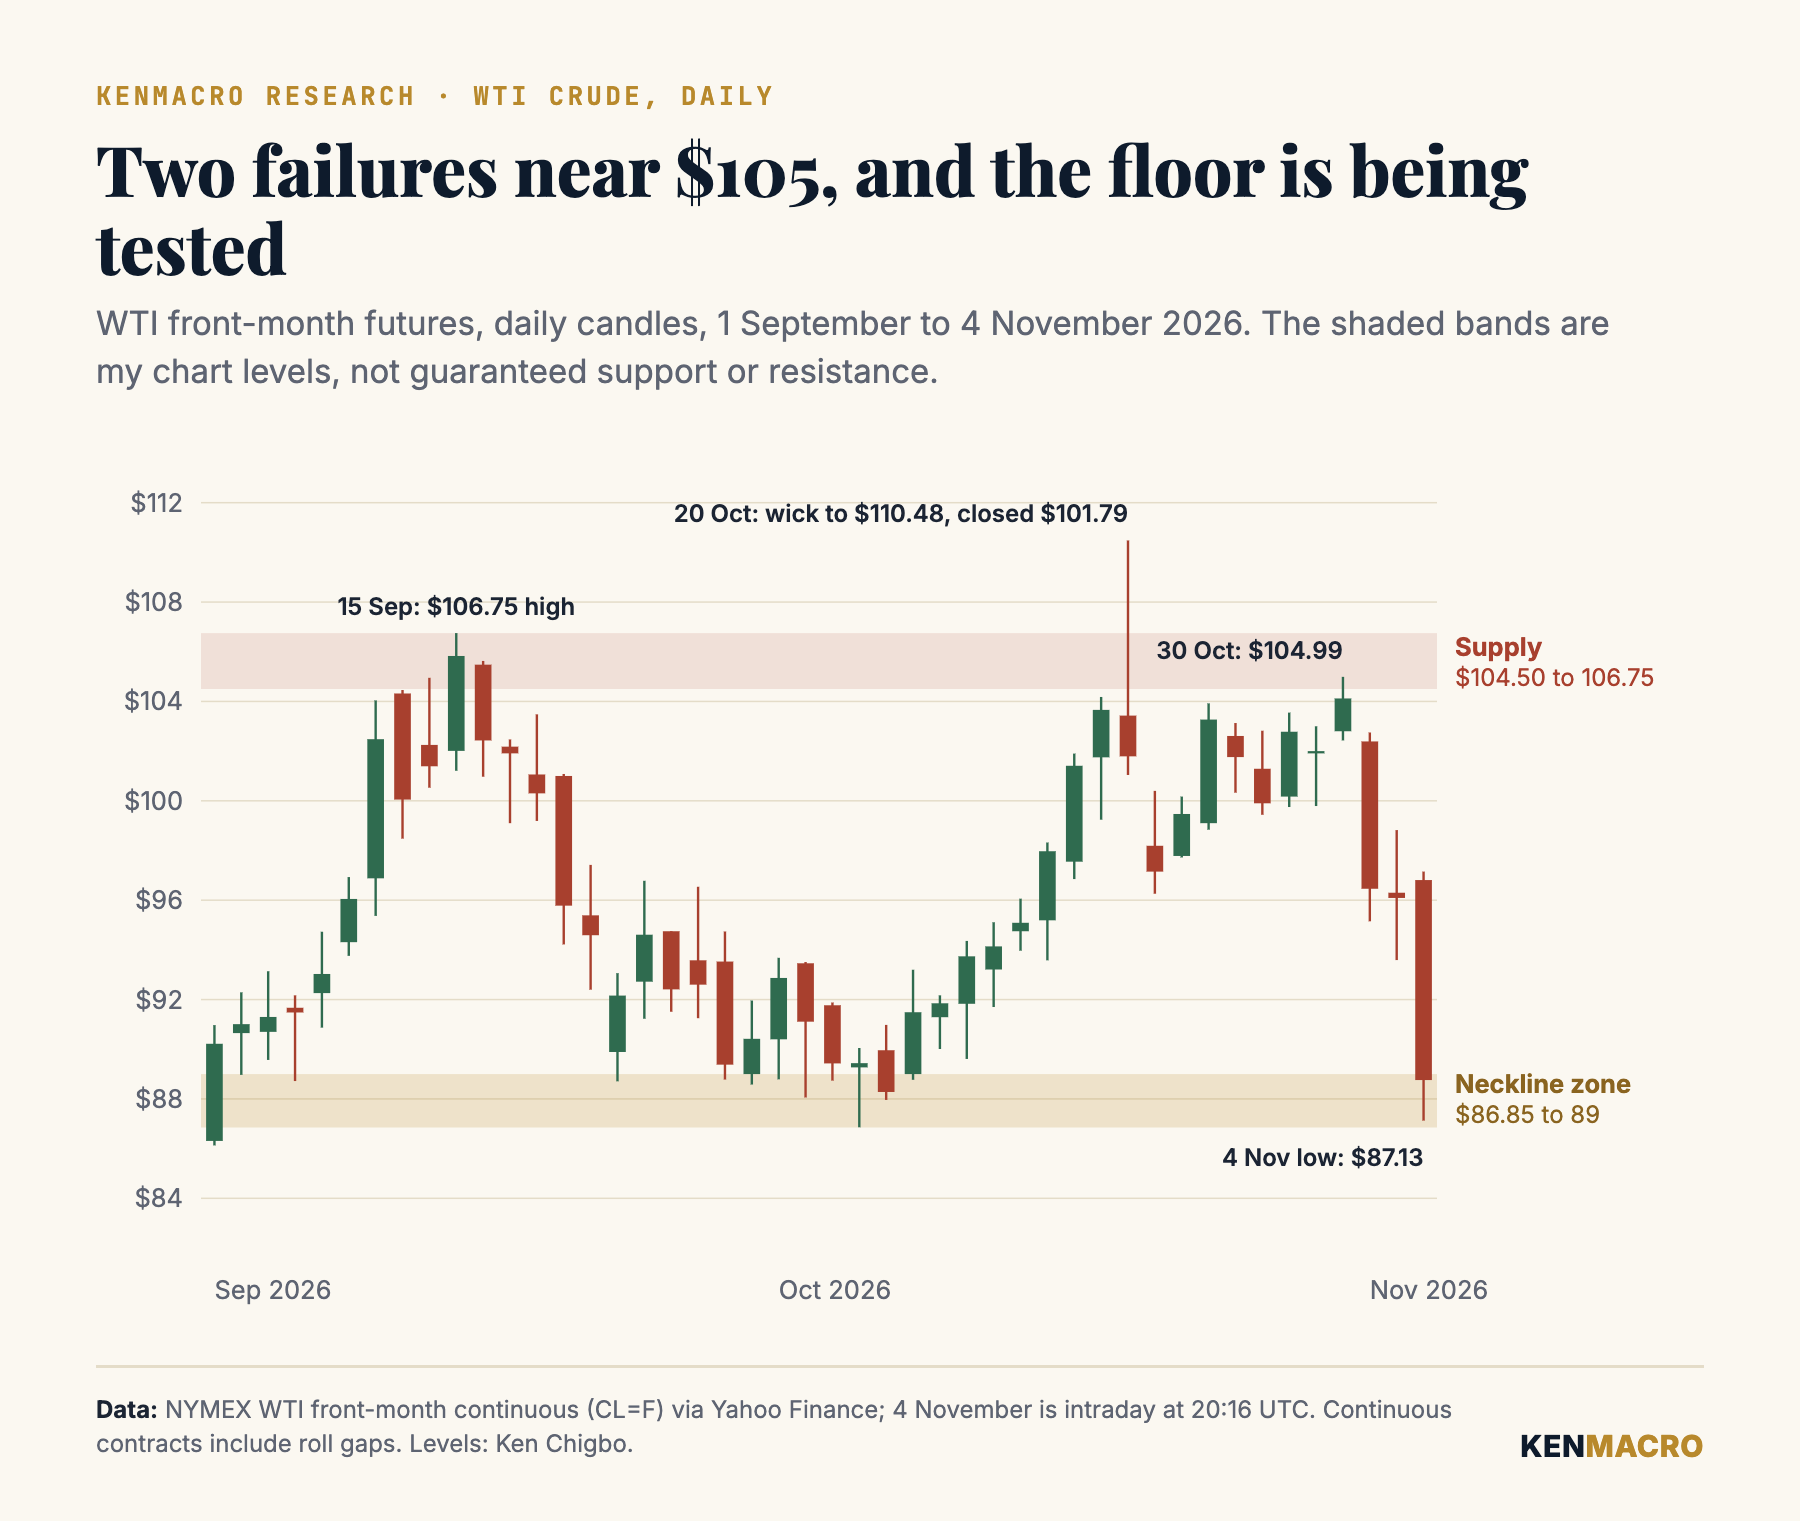
Underneath is the floor. Between late September and early October WTI bounced repeatedly from $86.85 to $89, and that’s the neckline of a potential double top. Today’s low of $87.13 put price right inside that zone.
But a double top isn’t confirmed because price has made two highs and dropped. It needs a break and a hold below the neckline, ideally a daily close beneath it, and then a failed attempt to reclaim it. We don’t have that yet. If it does confirm, the textbook projection is the height of the pattern, about $17, measured down from the break. That’s a projection, not a forecast.
Here’s how I’m thinking about the scenarios. If WTI closes and holds below $86.85, the bearish case gets much stronger, especially if the diplomacy keeps moving, and a retest of the broken neckline from underneath becomes the interesting area. If WTI holds the zone and bounces, the market may have removed too much risk too quickly, and a stalled negotiation or a fresh attack could send buyers back in aggressively. If price recovers into $104.50 to $106.75, the bearish structure is wrong and I’d say so.
That’s the point of a technical framework. It isn’t about predicting every candle. It’s knowing where the market confirms the idea and where it proves you wrong.
What it means for gold, the dollar, bonds and stocks
The US dollar. The Dollar Index fell to about 101.5. Lower oil takes some pressure off the Fed’s path, and the political shock has hit the dollar’s premium rather than US rates. But growth, risk appetite and liquidity matter too, so lower oil alone doesn’t guarantee a weaker dollar.
Gold. Gold jumped about 3.4% to roughly $4,076. Lower Treasury yields reduce the cost of holding a metal that pays nothing, and a softer dollar helps. The catch is that less war risk can also remove haven demand, so watch which force wins over the next few sessions rather than assuming today repeats.
Treasuries. The 10-year yield fell about 6 basis points to 4.89%. The Treasury also kept its coupon auction sizes unchanged at its quarterly refunding today. If investors believe inflation risk is moderating, longer yields have room to fall further, but the front end is anchored by December.
Stocks. The S&P 500 was up about 1.7% late in the session, around 7,701. Cheaper energy and lower yields help risk appetite. Energy shares went the other way as crude fell.
This is why I keep saying macro trading isn’t about memorising one correlation. It’s about understanding which regime is driving the move right now.
Have I changed my bullish oil view?
In my 27 October Brent outlook I was bullish. I said I was taking the diplomacy with a pinch of salt, and that I’d change my view if a durable settlement improved physical supply and Brent started building a confirmed bearish structure. I’ll be straight with you: the market has moved hard against that view.
My main condition, a durable settlement that improves physical supply, hasn’t been met. But WTI is now building a bearish structure, and that’s enough for me to respect the short-term downside. For the shorter-term trade, the bearish setup on WTI is the more relevant picture.
For the bigger picture, I still want to see a real agreement and a meaningful improvement in Hormuz flows before declaring the war premium permanently gone. There’s nothing contradictory about respecting a powerful bearish move while staying cautious about longer-term supply. That’s the difference between holding a rigid opinion and reassessing probabilities as the evidence changes.
What I’m watching next
- WTI and the $86.85 to $89 zone. A daily close and hold below it, or buyers defending it.
- The US and Iran. A credible framework through Qatar, or traders getting ahead of the actual progress.
- Yields, the dollar and December. Whether falling oil starts pulling December hike odds down, starting with October CPI on 10 November.
- Physical supply. Whether shipping through Hormuz and Gulf exports improve enough to justify removing the premium.
For now, the market is making one thing very clear. The inflationary story that drove the oil rally is being challenged. Whether that becomes a lasting disinflationary shift or another temporary geopolitical repricing is the question that matters, and it’s exactly why I never trade the chart in isolation.
- The complete macro and technical education library, including the Macro Trading Blueprint.
- Live New York market sessions with me, Monday to Friday at 14:00 UK.
- Session recordings, so you can watch back every session.
- The trading community, where we work through the macro, the charts and trade ideas together.
- The KenMacro Structure Desk indicator for TradingView, being rolled out to members on request.
Frequently asked questions
Why is oil crashing in November 2026?
Oil fell sharply on 4 November 2026 as markets priced a faster end to the US war with Iran after Democrats won control of Congress and the White House blamed petrol prices for the result. Trump also said there were no immediate plans to strike Iran. There is no confirmed peace agreement.
Are the Democrats’ midterm wins disinflationary?
Partly, at the margin. A Democratic Congress makes new tax cuts and large fiscal packages harder to pass and increases scrutiny of the war. It does not reverse existing tariffs, which mostly rest on executive authority, and the new Congress only sits from January.
Will falling oil prices stop the Fed hiking in December?
Not on its own. December hike odds were still about 79% on CME FedWatch after the oil drop. Lower oil makes further hikes after December less likely, but the Fed also needs evidence from core inflation, starting with October CPI on 10 November.
Is WTI forming a double top?
Possibly. WTI has failed twice near $105, with highs of $106.75 on 15 September and $104.99 on 30 October, and the neckline zone sits at $86.85 to $89. It is only confirmed by a sustained break and hold below that zone, not by touching it.
Could oil recover above $100?
Yes. If the Qatar-mediated talks stall, attacks on shipping resume or supply disruptions persist, the geopolitical risk premium could rebuild quickly. A recovery into the $104.50 to $106.75 supply zone would invalidate the bearish structure.
Research log. 4 November 2026: first published. Prices are dated intraday observations and will change. Chart levels are my own analysis, not guaranteed support or resistance. No KenMacro Structure Desk signal on WTI is shown because I could not verify one with a timestamp; the chart shows price structure only.
Get the macro framework the desk actually trades
The same regime-first framework behind every call on this site. Free. No spam, unsubscribe anytime.
Trading around macro shocks?
Gapping, headline-driven tape punishes the wrong broker setup. Check spreads, execution and the entity you open under before you open an account.
Continue reading
From the desk
Where this gets traded
Oil reprices in violent, headline-driven gaps, and execution through a supply shock is the whole game. See the KenMacro desk guide to the best brokers for trading oil.
Read the desk guide →