
Oil Price Forecast 2026: Why I’m Still Bullish on Brent Despite Iran Peace Talks
Donald Trump says America is making a fortune from higher oil prices, and there is some truth to that. The United States is the world’s largest oil producer, and higher crude prices can generate substantial additional revenue for American energy companies. But there is another side to that argument. American petrol is averaging around $4.29 a gallon and diesel about $6.35, US inflation has reached 3.7%, and the Federal Reserve is preparing for another interest rate decision with energy still expensive and the conflict involving Iran unresolved.
Brent crude was trading around $115 to $116 a barrel on Tuesday morning, and despite the recent diplomatic developments, I remain bullish on oil. I have watched repeated attempts to de-escalate this conflict, and I am taking the latest negotiations with a considerable pinch of salt. Not because I think diplomacy is impossible. A credible agreement could remove a significant amount of the geopolitical risk premium in oil, but the physical risks to energy infrastructure, shipping and regional supply have not disappeared simply because officials have agreed to keep talking.
So my working expectation remains that meaningful corrections in Brent will attract buyers, and I see a realistic possibility of another substantial move higher if negotiations deteriorate or more infrastructure is disrupted. The technical structure is becoming increasingly interesting alongside the supply picture, and with the Fed meeting this week and the US midterm elections on 3 November, the consequences reach well beyond the oil market.
Brent crude oil: the numbers behind my outlook
| Indicator | Latest observation | Why it matters |
|---|---|---|
| Brent crude futures | Between about $114.70 and $116.40 on Tuesday morning, 27 October; settled $115.81 on Monday | Still elevated despite renewed negotiations |
| Brent, Friday 23 October | Settled $116.72 | Highest close since 29 April |
| WTI crude futures | About $101 to $102 on Tuesday morning | The US benchmark is also above $100 |
| September Brent spot high | $131 a barrel on 15 September (EIA) | Shows the scale of the last supply-driven spike |
| US regular petrol | About $4.29 a US gallon, 26 October (AAA) | Higher household energy costs |
| US diesel | About $6.35 a US gallon, 26 October (AAA) | Transport and distribution pressure |
| US headline CPI | 3.7% year on year in September | Inflation remains well above target |
| US gasoline CPI | Up 9.1% in September alone | Over half of the month’s increase in the index |
| Federal Reserve decision | Wednesday 28 October, 18:00 London | The next read on how the Fed weighs energy inflation |
| US midterm elections | Tuesday 3 November | An important political deadline for negotiations |
Trump’s oil argument: America can produce more oil and still suffer from higher prices
At a campaign rally in Perry, Georgia, on Saturday 24 October, President Trump defended higher oil prices, saying the United States was making a fortune from the disruption. There is an important distinction here between what producers receive and what consumers pay. An American producer selling crude at $115 rather than $75 earns substantially more per barrel, and that revenue supports profits, investment, jobs and tax receipts in energy-producing states.
But higher producer revenue is not the same as a comparable improvement in the finances of every American household. Crude is priced in an international market, so US refiners, distributors, airlines, hauliers and motorists all remain exposed to globally set oil and fuel prices, and domestic production does not isolate the country from a global supply shock. The US Energy Information Administration is clear that crude prices are set by global supply and demand, while transport still depends heavily on petroleum products. Some American companies benefit considerably from higher oil prices, while other businesses see their costs jump. Both can be true at once.
What higher petrol and diesel prices mean for households
The US national petrol average has climbed from roughly $2.98 before the conflict began in February to $4.29 on 26 October, an increase of about 44%. Diesel has gone from about $3.76 to $6.35, up around 69%. For a motorist buying 15 gallons, that is roughly $20 more per fill-up than in February, and for a haulage company burning thousands of gallons of diesel the extra cost becomes far more substantial.
The problem does not end at the pump. Higher diesel costs feed into moving food, building materials, consumer goods and industrial products, higher jet fuel hits airlines, and energy-intensive manufacturers face higher production costs. Some businesses can pass that on to customers and others cannot, which squeezes their margins. The impact is uneven, but it adds up if expensive energy persists, particularly when interest rates are already restrictive and households are carrying expensive mortgages and other borrowing.
Why I’m not convinced the Iran peace talks have resolved the oil problem
On Monday 26 October, Saudi Defence Minister Prince Khalid bin Salman, Pakistan’s army chief Field Marshal Asim Munir and Turkey’s intelligence chief Ibrahim Kalin met Iranian leaders, including President Masoud Pezeshkian, in Tehran. The talks were aimed at preventing renewed military escalation, and Iranian state media said the parties agreed to continue discussions. Senior defence and security officials travelling together to Tehran is a meaningful development, and it shows regional governments are actively trying to contain the conflict.
However, there is a considerable difference between opening talks and delivering an agreement that restores normal energy flows. The parties remain divided over sanctions, maritime security and the wider military confrontation, and attacks on Saudi Arabia have continued, including Houthi claims about oil-related infrastructure over the weekend. Some of those claims have not been independently confirmed, which matters when judging the immediate impact on supply. But the vulnerability of that infrastructure is established, because the market has already lived through the consequences of a serious disruption.
The Strait of Hormuz is still the central supply problem
The Strait of Hormuz connects the Persian Gulf with the Gulf of Oman and the Arabian Sea, and before the conflict roughly one-fifth of global petroleum liquids consumption passed through it. Those volumes cannot all be redirected through other infrastructure, as the EIA’s assessment of the world’s oil transit chokepoints makes clear. Shipping through Hormuz has picked up a little since the worst of the disruption, but it is still running well below normal, and even where tankers are moving, insurance, delays and the risk of attack make transporting oil more expensive.
Restoring the physical flow of energy takes more than a diplomatic announcement. Shipowners need confidence in vessel security, insurers need to reassess the risk, exporters need reliable routes and buyers need reasonable confidence that cargoes will arrive on time. Until those conditions improve substantially, I am reluctant to assume the geopolitical risk premium has gone.
Saudi Arabia’s East-West pipeline is a major part of the bullish argument
One of the most significant developments in this conflict has been the exposure of Saudi Arabia’s alternative export infrastructure. The East-West pipeline carries crude across the kingdom to the Red Sea, avoiding Hormuz, and it has become increasingly important as Gulf shipping has been disrupted. In its October Short-Term Energy Outlook, the EIA reported that attacks on the pipeline temporarily halted flows in September. Before the attacks, the agency estimated it was carrying more than 5 million barrels per day of exports through the Red Sea port of Yanbu.
That disruption helped push Brent spot to as high as $131 a barrel on 15 September, as buyers rushed to secure near-term supply. It is a useful historical example of what happens when an important export route suffers a genuine interruption. The market was not simply reacting to the politics of an attack, it was reacting to the loss of physical barrels available to international buyers, and when the alternative routes are already under pressure, each new disruption matters disproportionately.
Why the pipeline matters for Brent prices
Consider the chain. Hormuz is operating under severe restrictions, so regional producers lean on alternative infrastructure to keep exporting, and those routes become more important to global supply. If one of them suffers a substantial interruption, buyers have fewer alternatives at short notice, which increases competition for prompt crude, lifts shipping costs and encourages refiners to build inventory. It can also raise the premium paid for immediate delivery over barrels further out.
That is why I watch the Brent futures curve as well as the outright price. When near-term contracts are substantially more expensive than later ones, a structure known as backwardation, it can signal tight immediate supply. It does not guarantee rising prices, but changes in the curve tell you something about physical tightness. So I want any renewed rally supported by both price structure and evidence that near-term supply concerns are still real. A bullish candlestick on its own is not enough.
My crude oil technical outlook: I still favour the upside
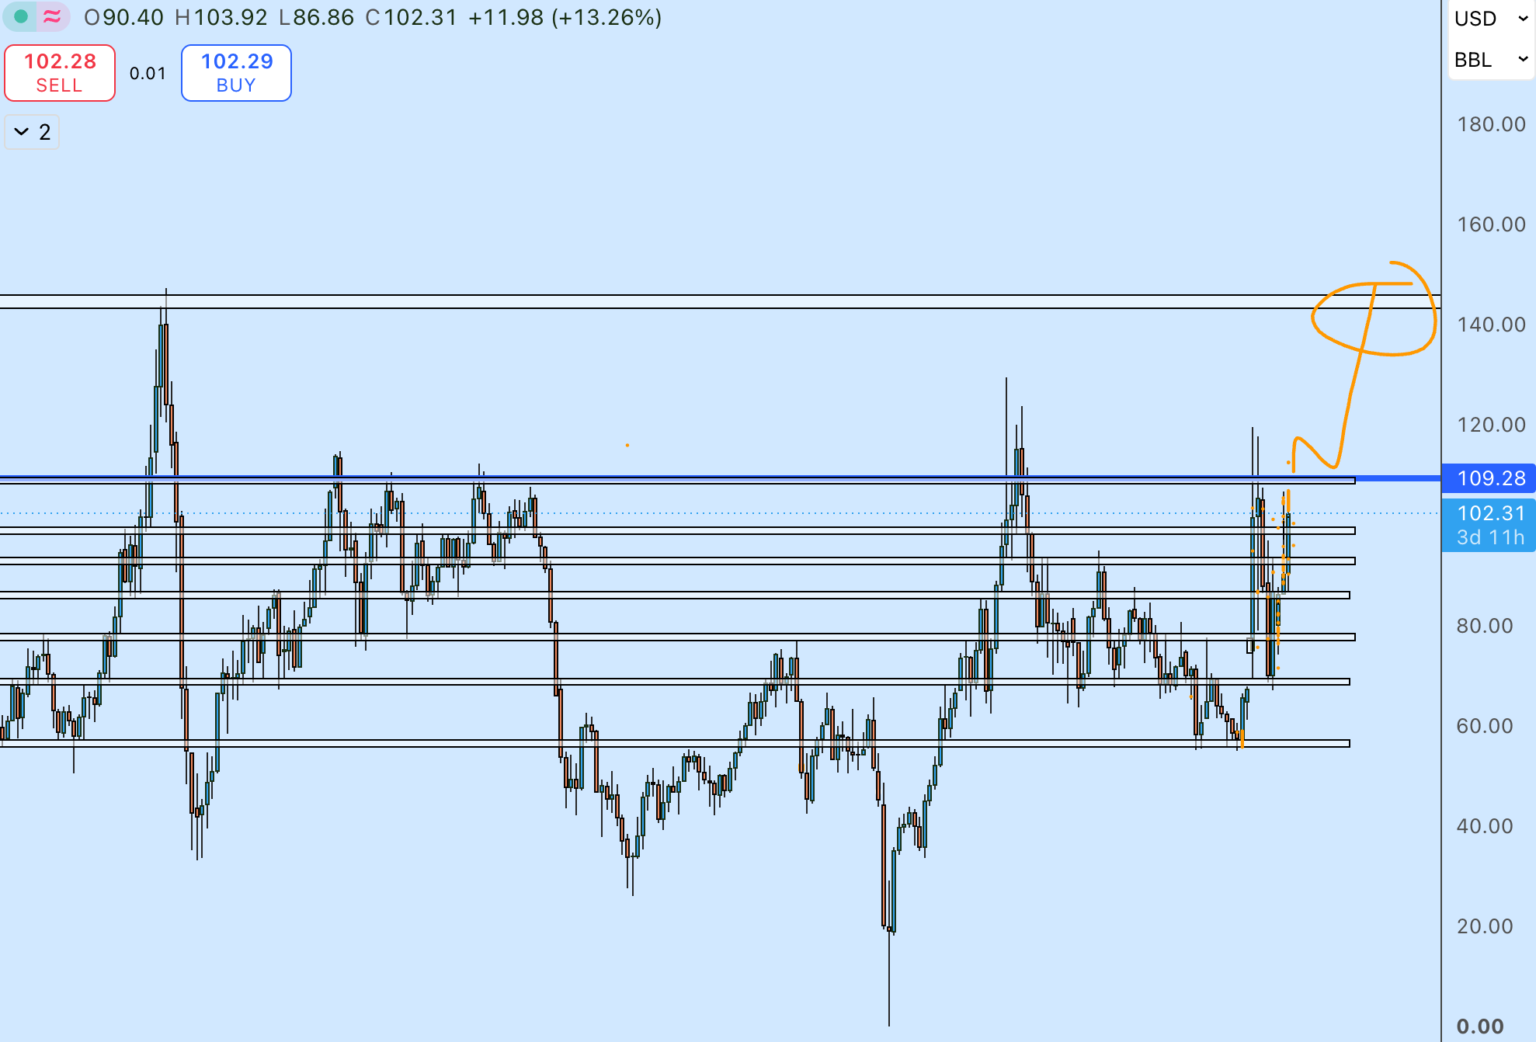
My technical assessment remains constructive. The chart above is US crude on the monthly timeframe, and it shows the bigger picture I am working from: October has already rallied about 13% from its open, and price is now pressing into the 109.28 level I have marked in blue. A report of progress in negotiations can send crude lower as traders cut the probability of further disruption, while a renewed threat, an attack or a breakdown in talks can reverse that just as quickly. I do not think the right approach is to chase every headline. My preference is to look for buying opportunities after pullbacks, provided the bullish structure stays intact, and there are four things I want the chart to tell me.
1. Is crude maintaining its higher-timeframe bullish structure?
I start with the monthly, weekly and daily charts. I want to see the market defend its important higher lows, and previous resistance starting to act as support. If a correction holds above a meaningful demand zone, that is consistent with buyers still being interested at lower prices. If price breaks down through major support and starts building lower highs and lower lows, I have to reassess, because a strong fundamental argument does not justify ignoring a deteriorating chart.
2. Are corrections being absorbed rather than becoming a reversal?
This matters most around diplomatic headlines. If Brent falls on reports of progress but buyers keep returning around established support, the market is reluctant to price a lasting improvement in supply. I then want the recovery to show buyers regaining control by breaking the relevant lower-timeframe swing highs. A recovery that stalls beneath those highs is far less convincing, and this is where I use the relationship between the higher-timeframe trend and the four-hour and one-hour structure.
3. Is the recovery supported by the wider macro picture?
I would be more confident in a bullish recovery if it came alongside fresh evidence of constrained supply, higher prompt-market premiums or developments that make a lasting agreement less likely. I would be cautious about buying an attractive-looking demand zone if physical supply were improving quickly and the market was pricing a credible reopening of the main transport routes. The technical setup and the macro conditions need to support each other.
4. Where would the bullish view be wrong?
A meaningful failure of higher-timeframe support would weaken the technical argument. A durable settlement, clearly better shipping conditions and more physical supply would weaken the fundamental argument, and if both happened together I would have much less reason to expect dips to attract sustained buying. The invalidation level has to come from the chart itself. I am not going to invent a support or resistance level that the actual price feed has not established. My preference is bullish, but confirmation matters more than conviction.
The IMF’s $130 oil scenario deserves attention
In its October World Economic Outlook, the International Monetary Fund projects global growth of 3.1% in 2026 and 3.4% in 2027, and it also examines what a more damaging energy environment would look like if the conflict escalates or the disruption persists. In my earlier analysis of the IMF’s Hormuz assumptions and oil shock scenarios, I looked at its adverse scenario with oil around $130 a barrel, which shows how a sustained energy shock could raise inflation while weakening growth. It is a stress test, not the IMF’s central oil forecast, and it should not be confused with my own technical view.
There is a good reason to revisit it, though. Brent spot has already reached $131 during the September pipeline disruption, so a move into that region is not purely theoretical. The question is whether the conditions that produced that spike could return or intensify. If energy infrastructure suffers another material disruption while shipping stays constrained, a renewed test of higher prices becomes a credible scenario, but the duration of the disruption, inventories, export alternatives and global demand would decide whether such a move could last.
The Federal Reserve faces a difficult week
The Fed’s October meeting runs on 27 and 28 October, with the decision due on Wednesday at 18:00 London time. September’s CPI showed annual inflation rising to 3.7%, with gasoline up 9.1% in the month and the broader energy index up 5.2%. Those figures make it hard to dismiss energy as a minor part of the inflation problem.
The Fed has to judge whether expensive energy is still a temporary relative-price shock or is starting to shape wider inflation expectations and underlying price pressure. Central banks cannot produce more oil or repair damaged pipelines. Monetary policy works through demand, financing conditions and expectations, so if energy costs start feeding into wages, business pricing and longer-term expectations, the pressure to stay restrictive increases. But higher energy costs also reduce consumer spending power and corporate profits, which weakens growth, so the Fed is weighing inflation against the risk of keeping borrowing costs too high for too long.
Thursday could be just as important as Wednesday
On 29 October the US publishes its first estimate of third-quarter GDP, with September PCE inflation also scheduled, less than a day after the Fed decision. Those releases could materially change expectations for the next meeting, because a strong economy with persistent inflation produces a very different market reaction from weak growth with elevated prices. For oil, growth matters because physical demand eventually responds to economic activity. If growth deteriorates substantially, that would work against my supply-driven view, so the real question is whether the supply disruption stays powerful enough to outweigh a weaker demand outlook. I do not treat higher oil as inevitable simply because geopolitical risk is elevated.
What higher oil means for Treasury yields, the dollar, gold and the Nasdaq
The US bond market has become particularly important to my analysis over the past few weeks. Earlier in October the 10-year Treasury yield moved above 5.3% after uncomfortable inflation data, then fell back towards 5% even though headline inflation stayed high. That tells you investors are balancing two risks: inflation forcing rates to stay restrictive, and expensive energy, high borrowing costs and pressure on earnings starting to weaken the economy.
Treasury yields. If oil keeps rising and inflation expectations increase, investors may demand higher yields on government debt. But if the same shock creates enough concern about growth and financial conditions, bonds attract defensive buying, which pushes yields down. Where possible I separate moves in nominal yields, real yields and inflation compensation, because each tells you something different about what the market is worried about.
The dollar. Higher US yields relative to other major economies can support the dollar, but lower Treasury yields do not guarantee dollar weakness. In periods of severe financial stress, demand for dollar liquidity can rise regardless of rate differentials, which is why I look at DXY alongside yields, broader sentiment and the major currencies.
Gold. Gold can benefit from geopolitical uncertainty and lower real interest rates, but renewed inflation fears can hurt it if they lift real yields or the dollar. So gold’s reaction to a fresh oil shock depends on more than the headline. I pay close attention to whether gold strengthens when equities weaken, and whether any rally is confirmed by the direction of real yields.
Nasdaq. Higher energy prices add to inflation concerns and press on margins and growth expectations, at a time when technology companies already face questions about the cost of AI investment and whether future earnings justify current valuations. If yields recover sharply, the discount-rate pressure on expensive equities increases. If yields fall because growth expectations are deteriorating, that is not a friendly environment for the Nasdaq either. An oil rally with rising yields is a different regime from an oil rally with falling yields and weakening stocks, so I watch these relationships together rather than assigning a fixed reaction to any one market. For more on this, read my research on hot US inflation, falling Treasury yields and the dollar.
Learn how I connect macro and technical analysis
I put so much weight on these relationships because a technical setup rarely exists in isolation. A chart can look attractive while the economic conditions underneath it are deteriorating, and a strong macro view still needs a sensible entry, an invalidation level and a proper risk assessment. That is the framework I am bringing together inside the new KenMacro Trading Club.
Members get my complete Macro Trading Blueprint, technical trading education, Gold (XAUUSD) Trading Mastery, intermediate macro education, the KenMacro Structure Indicator and live New York market sessions with me five days a week. Whether you are learning the fundamentals or already have years of chart experience, the education is built to help you understand what drives markets and how that connects to execution. Founding membership is $59/month for the first 100 paying members, kept for as long as you stay continuously subscribed.
Three crude oil scenarios I’m watching
| Scenario | What would support it | Implications |
|---|---|---|
| Bullish continuation (my preferred scenario) | Diplomacy stalls, physical supply stays constrained, buyers defend daily support and bullish structure returns | Brent could retest its recent highs and potentially extend further |
| Diplomatic de-escalation | A credible agreement, better shipping access, lower insurance and freight costs, a sustained recovery in physical supply | The geopolitical premium could unwind, producing a substantial correction |
| Demand deterioration | Weaker global growth, falling industrial activity and oil consumption, less physical tightness | Oil could weaken even without a full geopolitical settlement |
Scenario one: oil resumes its move higher
This remains my preferred scenario. The supply risks persist, negotiations fail to produce a durable settlement and buyers keep defending technically important areas during corrections. An eventual break above the relevant recent swing high, backed by the macro picture, would strengthen the case for further upside, and this is the environment in which I expect dips to attract buyers. The challenge is timing. Headline-driven moves can be violent and the first reaction often reverses, so I would rather wait for a technically credible setup than chase the market after a sudden spike.
Scenario two: diplomacy produces a genuine agreement
This is the biggest threat to the bullish thesis. A credible agreement that materially improves shipping and restores physical supply could strip out a large part of the geopolitical premium. In that environment I would not keep insisting oil must rise just because it was expensive before, because the physical fundamentals would be changing, and a sustained technical breakdown would confirm the market had started pricing that change.
Scenario three: demand weakens enough to outweigh supply risk
The global economy could deteriorate faster than expected, with consumers spending less, businesses cutting investment and industrial activity slowing. If that produces a meaningful fall in oil consumption, it could offset the upward pressure from constrained supply, especially if high borrowing costs and high energy prices start reinforcing each other. A bullish supply thesis still has to account for demand.
Could Brent crude return to $130?
Yes, a renewed move towards $130 is possible if the physical supply situation deteriorates significantly. The EIA recorded Brent spot at $131 during September’s East-West pipeline disruption, which gives us a recent reference point, but not a level the current futures contract has to reach. Before giving that scenario more weight, I would want fresh evidence of physical tightness, a convincing recovery through recent resistance and continued geopolitical risk. Credible diplomatic progress and recovering exports would reduce that possibility sharply. My core view is that the upside risk remains substantial, while the exact path and timing remain uncertain.
What I’m watching through the end of October
| Market or event | Why it matters |
|---|---|
| Brent daily and weekly charts | Whether corrections preserve the bullish structure |
| Brent futures curve | Evidence of immediate physical tightness |
| Strait of Hormuz shipping | Whether restrictions ease in a lasting way |
| Saudi export infrastructure | The risk of further disruption to the alternative routes |
| US Treasury yields | Inflation expectations versus growth concerns |
| FOMC, 28 October | How the Fed weighs inflation against growth |
| US GDP and PCE, 29 October | The strength of demand and underlying inflation |
| US midterms, 3 November | Political incentives around the negotiations |
| DXY, gold and the Nasdaq | How the oil shock is moving wider capital flows |
My outlook heading into November
I remain constructive on Brent. The diplomatic developments deserve to be taken seriously, but I do not think they justify treating the energy crisis as resolved. This conflict has already shown how vulnerable global oil supply becomes when critical transport routes are disrupted: Saudi Arabia’s alternative export infrastructure has been attacked, Hormuz shipping remains constrained, and the political timetable around the US midterms adds more uncertainty to the next few weeks. Personally, I still see a meaningful risk of another escalation after the elections if no durable agreement is reached beforehand. That is my assessment of the risk, not a claim that further military action is certain.
From a market perspective, I still expect buyers to show interest in meaningful Brent corrections while the supply constraints remain, and the chart will tell me whether those opportunities are developing. If higher-timeframe demand holds, lower-timeframe structure turns constructive and the physical supply argument stays intact, I will become more confident in the next bullish phase. If the macro picture improves and price breaks important support, I will reassess, because there is no advantage in defending a forecast after the evidence has changed.
For now, I am not convinced the oil market has finished repricing this conflict, and I think the risk of another substantial move higher is greater than the current diplomatic optimism suggests.
With Brent around $115 to $116, the Fed meeting this week and the US elections days away, the next few sessions could provide important confirmation of that view. I will keep following Brent, Treasury yields and the dollar together, and use the daily and four-hour charts to judge where the market is offering technically credible opportunities. The full calendar is in the Week Ahead, and for the political background read my piece on Trump, Iran and the oil shock before the US midterms.
Frequently asked questions
What is the Brent crude oil price forecast for the rest of 2026?
Ken Chigbo’s October 2026 outlook remains bullish, subject to market structure and physical supply conditions. Persistent disruption to Middle East exports could support another major rally, while a durable diplomatic settlement or weaker global demand could produce a significant correction.
Why are oil prices still high despite the Iran peace talks?
The talks have not yet removed the restrictions affecting energy infrastructure and shipping. The market is still pricing uncertainty around physical supply, transport costs and the risk of further disruption, and Houthi attacks on Saudi Arabia continued over the weekend of the Tehran meeting.
Could oil reach $130 a barrel again?
Yes, if supply conditions deteriorate materially. Brent spot reached $131 on 15 September 2026 during the East-West pipeline disruption, according to the EIA. That shows how sensitive the market is to real supply losses, but it is not a forecast that prices must return there.
How do higher oil prices affect inflation?
Higher oil raises petrol, diesel, transport and production costs. Persistent increases can feed into broader consumer prices and inflation expectations, although the size and timing depend on demand, margins, taxes and how businesses respond. In September 2026 gasoline accounted for over half of the monthly rise in US CPI.
Are higher oil prices good for the US economy?
They benefit US oil producers and some energy-sector workers and investors, but they also raise costs for households, transport firms, manufacturers and other businesses. The overall effect depends on how those gains and costs are distributed.
Why might Treasury yields fall while oil prices rise?
Investors may buy government bonds because they are worried about weaker growth, equity valuations or financial conditions. That extra demand pushes bond prices up and yields down, even while high oil prices are adding to inflation concerns.
What would invalidate a bullish oil forecast?
A durable agreement that restores shipping and exports, a clear improvement in physical supply, materially weaker demand, or a confirmed bearish change in higher-timeframe market structure would all weaken the bullish view.
Ken Chigbo is the founder of KenMacro and a macro trader and financial-markets educator with about 18 years in the markets. Through KenMacro he publishes educational analysis on central banks, inflation, interest rates, currencies, gold and commodities, built around understanding the economic forces behind a market before evaluating the chart. Find more research in the KenMacro Macro Insights. About Ken.
KenMacro Research provides market commentary and education, not individual financial advice. This analysis is Ken Chigbo’s interpretation as at the research date above. If the Fed decision, a diplomatic breakthrough or an infrastructure incident changes the outlook, a dated update will be added rather than the original forecast being rewritten. Market conditions can change rapidly and trading involves substantial risk of loss, particularly where leverage is used. The KenMacro Trading Club is a KenMacro product and the terms on the Club page and at checkout apply.
From the desk, free
Get the macro framework the desk actually trades
The same regime-first framework behind every call on this site. Free. No spam, unsubscribe anytime.
Trading around macro shocks?
Gapping, headline-driven tape punishes the wrong broker setup. Check spreads, execution and the entity you open under before you open an account.
Continue reading
From the desk
Where this gets traded
Oil reprices in violent, headline-driven gaps, and execution through a supply shock is the whole game. See the KenMacro desk guide to the best brokers for trading oil.
Read the desk guide →