Gold Hovers Below $4,710 After Three-Week High: CPI and Iran the Binary

Gold ran into the $4,775 ceiling yesterday, took a profit-taking hit overnight, and currently trades $4,705.90 as the desk writes this. The story is not the price. The story is what the price is choosing not to do. The dollar is bid, oil is bid, Iran tension is escalating, and CPI is hours away. In a normal regime, that mix sends gold higher with conviction. Instead, gold is sitting on a three-week high, refusing to extend, refusing to capitulate, waiting for one of the three macro variables in front of it to break a different way. That is the trade.
Quick answer
Gold is consolidating, not capitulating. The market is choosing between two different gold trades, and the choice will be made by the CPI print and the Iran tape, not by the technicals.
By Ken Chigbo · Founder, KenMacro · 18+ years in markets, London trading floor and institutional FX
Gold is consolidating, not capitulating. The market is choosing between two different gold trades, and the choice will be made by the CPI print and the Iran tape, not by the technicals.
Quick Answer · gold session read
- ☐ Gold trades $4,705.90 after tagging a three-week high of $4,775 in yesterday’s session. The pullback is profit-taking, not regime change.
- ☐ US CPI lands today. Headline forecast 3.7% YoY (up from 3.3%). Hot print extends DXY bid and pressures gold short term. Cooler print releases the gold bid that the Iran tape has been holding back.
- ☐ DXY is bid (98.29, +0.33% on the session) on inflation-impulse repricing. That headwind alone explains why gold is rangy instead of running.
- ☐ Iran-US ceasefire on “massive life support” after Trump rejected Tehran’s counter-proposal. The geopolitical bid is intact, just not winning.
- ☐ Confluence resistance: $4,710 (4-lens), $4,725 (4-lens), $4,758 to $4,775 (3-lens). Confluence support: $4,671 (3-lens), $4,655 (2-lens). Loss of $4,655 voids the consolidation read.
Yesterday’s session, in one paragraph
Gold opened the European session around $4,720, ran with conviction through London into NY as Iran ceasefire headlines deteriorated, tagged $4,775 just after the NY open, then started fading. The afternoon session was profit-taking with the dollar quietly bidding into the close. By the Asian handover, gold had given back $60 from the high and was sitting just under $4,710. The desk’s read on yesterday: the buying was real, the rejection was real, and the marginal buyer at $4,775 is not in size at $4,775 again until something forces them in. Either a hot CPI that fades risk assets and lifts gold as the inflation hedge, or an Iran escalation that re-prices war-premium across crude and metals together.
Why gold is rangy when it “should” be running
The honest answer is the dollar. DXY trades 98.29, up 0.33% on the session, and that 0.33% is doing more to suppress gold than the Iran headlines are doing to lift it. The mechanism is rate-differential repricing. Oil pushing through $100 rebuilds the inflation impulse the market had been pricing out across April. Higher inflation expectations push “Fed cuts twice by year-end” off the table, put “higher for longer” back on, and in some corners of the rates market the tail risk of an outright rate hike is being whispered about. That whisper is dollar-bullish. And a bid dollar caps gold even when every other gold variable is screaming higher.
The desk has seen this setup before. It was the second half of 2022 in miniature. Inflation impulse, hawkish Fed repricing, dollar grinding higher, gold pinned in a range despite real-world reasons to extend. The way out of that range was eventually a Fed pivot signal that compressed real yields. Until something analogous arrives, gold is bid on dips and capped on rallies. That is the regime, and the regime explains the chop.
Get the framework the desk runs every morning. Free. No card. The same institutional structure the MACRO MASTERY desk uses on every read.
The CPI map, in plain English
Headline CPI prints today. Consensus is 3.7% YoY (up from 3.3% previous) and 0.6% MoM (slowing from 0.9% prior). Core CPI consensus is 3.6% YoY and 0.3% MoM. The desk treats the print as a three-way conditional rather than a single number.
| Scenario | Gold read | |
|---|---|---|
| Hot | ≥ 3.8% headline or ≥ 3.7% core | DXY extends, gold pressed toward $4,671 support. Inflation-hedge buyers wait below $4,700. |
| In line | 3.6 to 3.8% headline + 3.5 to 3.7% core | Range continues. Gold consolidates $4,671 to $4,775 with Iran tape as the marginal driver. |
| Cool | ≤ 3.5% headline or ≤ 3.4% core | DXY rolls, gold releases the suppressed bid. $4,758 to $4,775 challenged within hours. |
The print at 13:30 BST is the binary that sets the next 48 hours. Anything in the “in line” middle band keeps the range alive. The tails are where the action is.
The Iran tape, why it still matters for gold
Trump rejected Iran’s ceasefire counter-proposal Sunday night, described the negotiating posture as “garbage” in public, and said the ceasefire is “on massive life support”. The Strait of Hormuz remains largely closed since the war began on 28 February. Roughly 17 to 20 million barrels per day of crude and condensate plus 30% of global LNG used to transit that strait. None of that flow has normalised. Oil cleared $100, the dollar is bid on inflation impulse, and gold is sitting on a three-week high.
Where the Iran tape matters specifically for gold is the tail. Most days the Iran headlines are just noise that pulses through the war-premium component of crude. But there is a non-trivial probability that this stalemate breaks toward escalation rather than diplomacy. A US naval action to force the strait open, an Israeli strike inside Iran, an Iranian decision to mine the channel: any of these re-prices gold the same direction as oil, and would do so faster than CPI moves the dollar. The gold long who is holding through a hot CPI is the gold long who is paid for the tail. Not for the headline.
Gold levels, six-lens confluence
The desk runs every level through six independent lenses (floor pivots, anchored moving averages, structural swings, round numbers, prior range markers, volume profile) and only publishes zones that get hit by at least two lenses. Anything that fails confluence does not earn the print.
| Direction | Level | Confluence |
|---|---|---|
| R · upside | $4,710.20 | Round $4,700 + recent swing low flip + pivot S3 (4-lens) |
| R · upside | $4,725.00 | 5-day Point of Control + prior day low + daily pivot P (4-lens) |
| R · upside | $4,758 to $4,775 | Round $4,750 + 50 SMA daily + yesterday’s high (3-lens). Daily close above $4,775 unlocks $4,820. |
| Spot | $4,705.90 | Current, cross-verified |
| S · downside | $4,671.00 | Prior week low + recent swing low + round $4,675 (3-lens) |
| S · downside | $4,655.10 | Round $4,650 + recent swing low (2-lens) , loss of this voids the consolidation read |
Spot is sitting just below the four-lens $4,710 zone. That is the level that has to clear on a 1-hour close for any upside attempt at $4,725 to have legs. Below, the structural support sits at $4,671 (three-lens). Lose $4,655 on a daily close and the consolidation is over; what looks like a coiled spring becomes a failed breakout retrace, and gold opens up toward $4,580 to $4,620.
Trading gold directly
For XAU/USD as a CFD with raw spreads and Tier-1 regulation, the desk uses Vantage. ASIC, FCA, VFSC. Lloyd’s of London $1m client insurance on regulated entities. Spreads from $0.12 on gold.
ASIC regulated. The desk’s preferred broker for retail macro traders who want the MACRO MASTERY desk overlay alongside the platform.
Cross-asset map
Cross-asset response · what’s pulling on gold
| Asset | Read | For gold |
|---|---|---|
| DXY 98.29 (+0.33%) | Bid on inflation-impulse repricing, higher-for-longer back in play | ↓ headwind |
| WTI $101.31 (+3%) | Cleared $100, war premium back in price, inflation impulse rebuilt | ↑ tailwind |
| US10Y | Soft into CPI, real yields the swing variable | ↑ tailwind if real yields fall |
| USDJPY 157.59 | Holds 157 handle, BoJ stays sidelined, yen weakness intact | ↑ JPY-priced gold bid |
| Silver / XAGUSD | Tracking gold lower today, ratio at 78 | ↓ no breakout confirm |
Scenario map for the next 48 hours
Range continues
CPI prints in line, Iran tape stays loud but inconclusive. Gold trades $4,671 to $4,775 for another two sessions. DXY caps every rally near $4,758. Buyers defend $4,671 on dips. Bored is the dominant emotion.
Upside break
Cool CPI or Iran escalation lifts gold through $4,775 on a daily close. Next stop $4,820, then $4,880. Driven by real-yield compression (CPI path) or war-premium repricing (Iran path), or both. DXY rolls back to $97.63.
Downside break
Hot CPI + a diplomatic step-down on Iran. Gold loses $4,671, accelerates to $4,580 to $4,620, possibly tags $4,500 round number within a week. DXY extends to $99 handle. The consolidation pattern fails as a bull-trap retest.
Ken’s chart and read
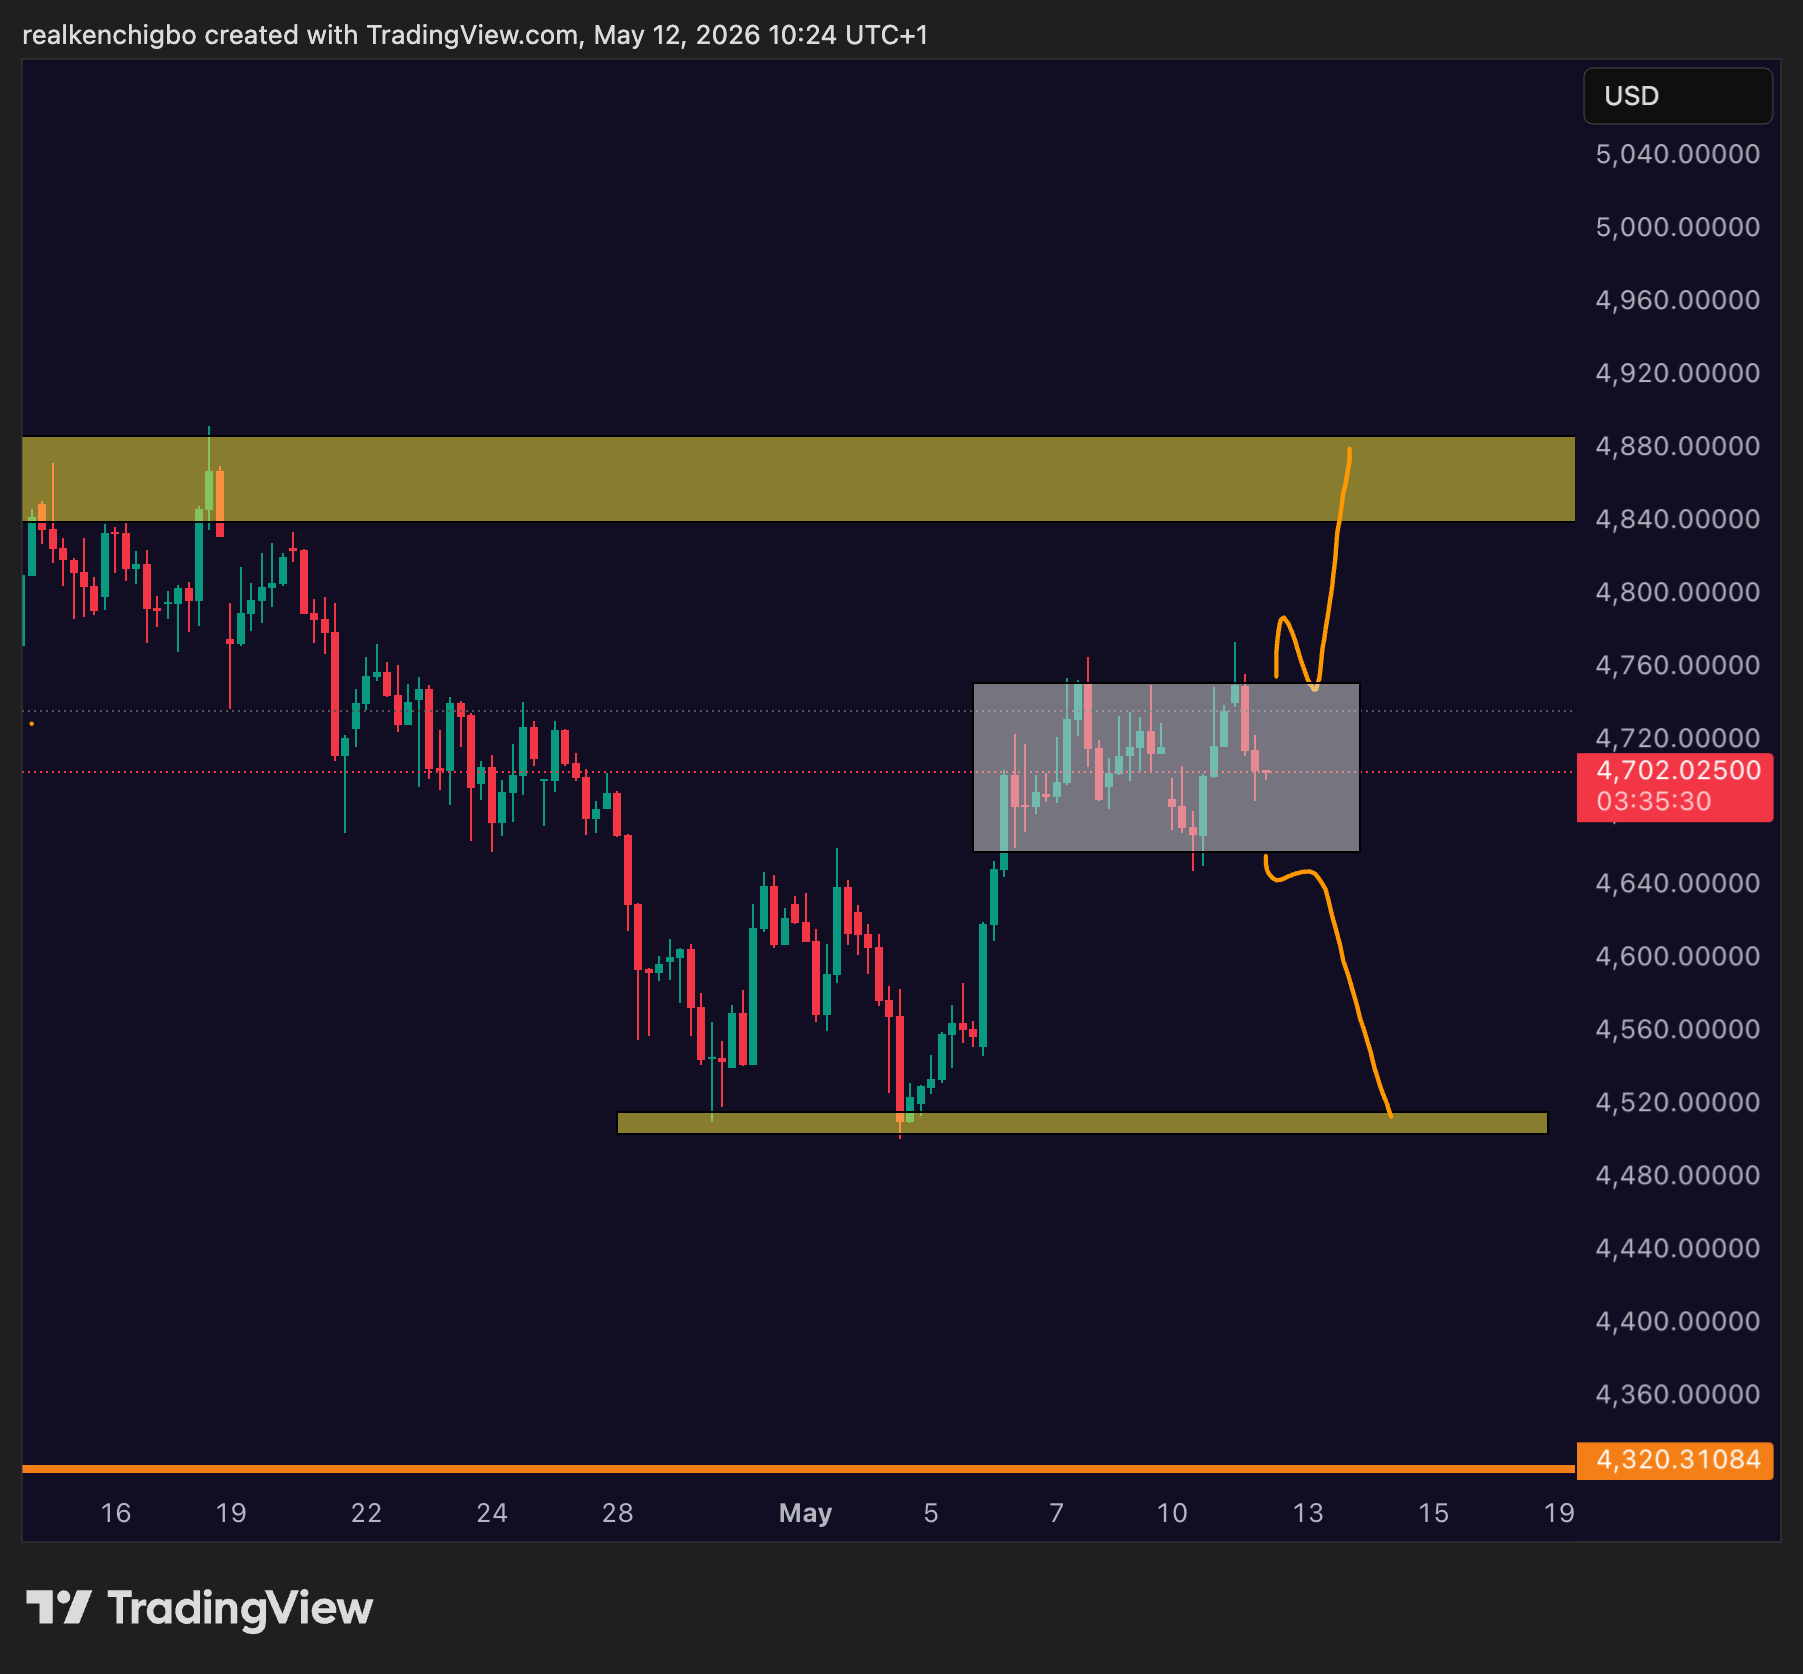
Ken’s read on the 4H
- 01Gold is range trading on the 4H.The 4-hour tape is not trending right now. It is a clean range, capped above and bid below, and that is the structural read going into the print.
- 02Range top around $4,760.The upper boundary sits close to $4,760. Sellers have repeatedly defended this band over the past sessions, and it is the line buyers need to clear with conviction for the range read to break.
- 03Range bottom around $4,660.The lower boundary sits close to $4,660. That is roughly a $100 range, which is the field of play. Inside the range, neither side has the conviction to take the price out alone.
- 04The breakout is likely a CPI move.This range gets resolved by the print, not by intraday flow. Until 13:30 BST, expect the tape to keep pinning. After 13:30, the reaction is the trade.
- 05Upside near $4,900, downside near $4,500.If the breakout fires up, the next major liquidity sits close to $4,900. If the breakdown wins, the next major liquidity pool sits at $4,500. Both are structural draws, both depend on the print.
CPI-day gold is the kind of session the desk is built for. Members receive named levels, the CPI-conditional map, and live tape calls inside Discord as the print lands.
ASIC regulated. Raw-spread ECN execution. Built for active intraday forex and index traders who care about cost per round-turn.
What would invalidate this view
Invalidation triggers
- Daily close below $4,655. Voids the consolidation read. Reframes as a failed retest of the three-week high.
- CPI prints ≤ 3.4% headline and ≤ 3.3% core. Cooler-than-expected releases the gold bid that the dollar has been suppressing. $4,775 challenged within hours.
- Diplomatic break on Iran. A formal ceasefire-restart announcement (not a posture shift, an actual schedule) fades the geopolitical bid in gold by $40 to $60 within hours.
The final read
Gold is a coiled spring waiting for one of three variables to flip. The dollar is the immediate cap, CPI is the binary that resolves the dollar question, and Iran is the tail risk that re-prices the whole thing if it breaks the wrong way. The structural setup says higher. The tactical setup says rangy until one variable moves. The desk’s framework: long-term holders sit on hands, intraday traders work the $4,671 to $4,775 range, and everyone watches 13:30 BST.
Gold is consolidating, not capitulating. That is a very different setup, and it pays a very different way.
, Ken Chigbo, KenMacro Desk
ASIC and FSCA regulation. Cent-account option for small balances. Leverage up to 1:1000 on the offshore entity for the high-leverage archetype.
In short
- Gold tagged $4,775 yesterday, profit-takers wound it back to $4,705.90. The setup is consolidation, not capitulation.
- CPI at 13:30 BST is the binary. Hot extends DXY and presses gold to $4,671. Cool releases the suppressed bid toward $4,775 and beyond.
- Iran tail risk is intact. The gold long is paid for tail, not for headline. Levels: $4,710 / $4,725 / $4,775 up, $4,671 / $4,655 down.
Related reading on KenMacro
- How to Trade Gold: The Institutional Framework →
- How to Trade CPI: The Macro Trader’s Guide →
- Oil Surges Above $100 as Trump Slams Iran Ceasefire →
- Real Yields Explained: The Single Most Important Gold Driver →
Related from the desk
- How to Trade DXY (the US Dollar Index): The Macro Trader’s Guide
- Powell Legacy: Fighting Inflation and Trump at the Fed
- Oil Price Crash if War Ends: Brent, Gold, DXY Decoded
- Gold Weekly Recap, 5-9 May 2026: XAU/USD Bounces $200 From $4,500 as NFP Beats
- Trump Pauses Project Freedom: Oil Dumps, Gold Rallies, Dollar Cracks
FAQ
What is the current gold price today, 12 May 2026?
Gold (XAU/USD) trades $4,705.90 at the time of writing, having retreated from a three-week high of $4,775 set in yesterday’s NY session. The pullback is profit-taking against a bid US dollar, not a regime change. Spot is cross-verified across Yahoo Finance and major broker feeds.
Why is gold falling today when Iran tensions are rising?
Gold is rangy rather than running because the US dollar is bid (DXY 98.29, +0.33%) on rate-differential repricing. Oil at $100-plus rebuilds the inflation impulse, which pushes higher-for-longer rate expectations back into play and supports the dollar. A bid dollar caps gold even when geopolitical tail risk is real. The Iran bid is intact, the dollar bid is just winning the daily skirmish.
What is the next gold resistance level?
The first confluence resistance is $4,710.20, a four-lens cluster of the round-number $4,700 zone, recent swing low flip, and pivot S3. Above that, $4,725 is another four-lens cluster (five-day Point of Control, prior day low, daily pivot P). The bigger ceiling sits at $4,758 to $4,775, where the 50-day SMA and yesterday’s three-week high converge. A daily close above $4,775 unlocks $4,820.
What gold support level matters most right now?
The structural support is $4,671, a three-lens cluster of the prior week low, recent swing low, and the round-$4,675 reference. Loss of $4,671 opens $4,655 (round $4,650 plus recent swing low). A daily close below $4,655 voids the consolidation read and reframes the tape as a failed retest of the three-week high.
How will US CPI affect the gold price?
US headline CPI consensus is 3.7% YoY (up from 3.3%) with core at 3.6% YoY. A hot print (above 3.8% headline or 3.7% core) extends the dollar bid and pressures gold toward $4,671. A cool print (below 3.5% headline or 3.4% core) compresses real yields and releases the suppressed gold bid, with $4,758 to $4,775 challenged within hours. An in-line print keeps the range alive and hands the next move to the Iran tape.
Is gold still in an uptrend in May 2026?
Gold’s structural uptrend remains intact on the daily timeframe. Year-to-date gold is up 11.93%. The 200-day SMA is well below current price. The recent action is consolidation just below the all-time highs near $5,294 set in March. Within that bigger picture, the daily tape is rangy because the dollar is bid on inflation-impulse repricing. The trend is up. The session is sideways.
Why is gold not a clean safe-haven trade right now?
Two reasons. First, the dollar is bidding against gold on rate-differential repricing rather than fading on growth concern, so the cross-asset trade is unusually crowded. Second, gold long positioning is already heavy from the spring rally, so the marginal buyer needs a clearer catalyst than a single Iran headline. The safe-haven mechanism is working, it just needs either CPI or an Iran escalation to actually trigger the next bid wave.
What is the relationship between gold and the US dollar today?
Gold and the dollar are trading their traditional inverse correlation, with the dollar leading. DXY at 98.29 is up 0.33% on the session, which is exactly the headwind that has kept gold pinned just below $4,710 even as oil has cleared $100 and Iran tensions have escalated. If DXY rolls back through $98.08 support, gold typically extends. If DXY clears $98.34 resistance, gold typically pulls back further.
What would invalidate the bullish gold view?
Three triggers. First, a daily close below $4,655 voids the consolidation pattern. Second, a hot CPI print (3.8% headline plus) extends the dollar bid and gives the bears momentum. Third, a formal Iran ceasefire restart fades the geopolitical premium by $40 to $60 within hours. None of the three has happened yet, but two of them are conditional on today’s data.
How should traders position for the CPI print today?
The desk does not publish trade recipes. The framework: the range is real, the binary is real, and the tail risks are real on both sides. Most retail traders are best served sitting on hands through 13:30 BST and reacting to the actual print plus the actual tape rather than trying to predict it. For active traders, the levels above are the levels: $4,710 / $4,725 / $4,775 up, $4,671 / $4,655 down. Size to risk, not to opportunity.
Sources: FXStreet, FXEmpire, LiteFinance, Trading Economics, Reuters wire, Investing.com. Spot data cross-verified across Yahoo Finance and major broker feeds via the KenMacro pricing engine. Iran headlines via CNBC, Washington Post, NBC News, Irish Times.
Continue reading