S&P 500 Closes Record $7,412 Despite Iran Rejection: Today’s Pullback Tests Dip-Buy Conviction

The S&P 500 closed yesterday at $7,412.84, its first close above $7,400, on a session where Trump publicly rejected Iran’s ceasefire proposal as “garbage” and oil cleared $100. That tells you everything about the regime equity dip-buyers are in. Headline risk hits, futures wobble for an hour, somebody steps in, the close prints higher than the open. Today is the first day in roughly a week where the futures tape is actually softer into European trade, and the question every desk is asking quietly is whether this is the digestion phase Sam Stovall at CFRA has been describing, or whether this is the day the dip-buying conviction finally cracks.
Quick answer
The bid in stocks is real, the optimism is real, and the dip-buying is real. The question is no longer whether the regime persists. The question is what specifically would break it, and whether that specific thing is closer than the consensus thinks.
By Ken Chigbo · Founder, KenMacro · 18+ years in markets, London trading floor and institutional FX
The bid in stocks is real, the optimism is real, and the dip-buying is real. The question is no longer whether the regime persists. The question is what specifically would break it, and whether that specific thing is closer than the consensus thinks.
Quick Answer · stocks session read
- ☐ S&P 500 closed $7,412.84 yesterday, first close above $7,400. Nasdaq Composite closed $26,274.13. Both at fresh record highs.
- ☐ Today’s futures softer ahead of the US session as traders digest the Trump-Iran rejection plus the CPI print at 13:30 BST.
- ☐ Bullish sentiment is intact. Every dip on Iran headlines over the past three weeks has been bought. CFRA’s Sam Stovall has been calling this a “digestion phase” within a broader bull run.
- ☐ The genuine downside risk is no longer Iran headlines. It is US military action against Iran in response to the negotiating breakdown. That single tail event flips the regime.
- ☐ CPI today is the immediate binary. Hot extends the dollar, pressures rate-sensitive growth names. Cool releases the rate-cut bid, lifts long-duration tech, supports the index higher.
Yesterday’s tape, in one paragraph
Stocks opened heavy Monday on the news that Trump had rejected Iran’s ceasefire counter-proposal over the weekend. Energy and defence rallied. Tech wobbled. By the New York lunch, the dip had been bought hard, with mega-cap tech leading the recovery. The S&P 500 grinding back to flat by mid-afternoon was the read. The S&P 500 actually closing positive into the bell, at a fresh record above $7,400, was the conviction. Nasdaq mirrored the pattern, closing at $26,274.13 after spending the morning in red. Defensive sectors, the genuine safe-haven plays, did not see the volume that would normally accompany a real risk-off rotation. That is what dip-buying with conviction looks like.
Why the bid keeps showing up
Three reasons that all reinforce each other. First, positioning. Systematic strategies have been steadily adding equity exposure as realised volatility has been declining and the trend filters have been turning long. Vol-target funds are mechanically buying as vol compresses. CTAs are long. Risk parity is overweight equities relative to bonds. None of that is sentiment, it is mechanics, and the mechanics are not going to flip on a single Iran headline.
Second, earnings. Q1 2026 earnings season delivered roughly 11% blended growth across S&P 500, ahead of consensus going in. Margins held up better than the bears expected, with services-side companies absorbing the persistent wage pressure better than goods-side. That is a fundamental tailwind that does not care about geopolitical headlines except where they show up in commodity costs.
Third, the Fed reflex. The market has been quietly reading “anything that complicates the Fed’s path eventually forces a dovish pivot” for so long that it has become reflexive. Hot inflation makes the Fed hawkish short term, sure, but it also raises the probability of a growth scare later in the year, which raises the probability of a dovish pivot, which is bullish for stocks. That is the elaborate three-step logic the dip-buyers are running. It has worked all spring. It will keep working until it stops.
Get the framework the desk runs every morning. Free. No card. The same institutional structure the MACRO MASTERY desk uses on every read.
Today’s tape: the digestion test
Futures came into European session softer. SPX futures are trading roughly 0.3% below yesterday’s cash close. Nasdaq futures softer by similar magnitude. The dollar is bid (DXY 98.29, +0.33%), oil is bid (WTI $101.31), and gold is rangy. The setup heading into 13:30 BST CPI is: stocks have to digest the inflation impulse from oil at the same time the geopolitical risk premium is being repriced. That is a lot of work for one session.
The desk’s framework for today: the dip-buying conviction is tested at the level not the headline. Specifically, S&P 500 needs to hold $7,374 (yesterday’s intraday low) on any post-CPI weakness. A break of $7,374 with size opens up $7,330 (50% retrace of the late-April rally) and then $7,300 (round number plus 20-day SMA). Holding $7,374 confirms the digestion read and sets up a retest of $7,412.84. The desk thinks the holders win this skirmish, but the risk-reward is not symmetrical anymore.
Trading the indices
For SPX 500 and NDX 100 as CFDs with Tier-1 regulation, the desk uses Vantage. ASIC, FCA, VFSC. Raw spreads on indices, fast execution into US session liquidity. Index trading without the futures account complexity.
SPX levels that matter today
| Direction | Level | Why |
|---|---|---|
| R · upside | $7,412.84 | Yesterday’s all-time close, first print above $7,400 |
| R · upside | $7,450 to $7,475 | Round-number cluster + measured-move extension of the April breakout |
| Spot zone | $7,374 to $7,412 | Yesterday’s intraday range, today’s pivot zone |
| S · downside | $7,374 | Yesterday’s intraday low, first defended level for dip-buyers |
| S · downside | $7,330 | 50% retrace of the late-April rally, structural support |
| S · downside | $7,300 | Round number + 20-day SMA. Loss of this breaks the dip-buy pattern. |
Nasdaq parallel: yesterday’s close $26,274 is the immediate reference. Above $26,500 unlocks measured-move extension toward $26,800 to $27,000. Below $26,000 round-number support, the dip-buy pattern starts to fail and the index opens up toward $25,650 (50-day SMA region).
Cross-asset map
Cross-asset response · what’s pulling on stocks
| Asset | Read | For stocks |
|---|---|---|
| WTI $101.31 (+3%) | Above $100, inflation impulse rebuilt, margin pressure on consumer | ↓ headwind |
| DXY 98.29 (+0.33%) | Bid on rate-differential, capping multinational EPS translation | ↓ headwind |
| US10Y | Soft into CPI, real-yield direction the swing factor for long-duration tech | ↑ tailwind if yields fall |
| Energy sector | Bid on oil reclaim, XLE leading SPX subgroups | ↑ index support |
| Defensive sectors | No size rotation visible, the tell against real risk-off | ↑ confirmation of dip-buy |
| VIX | Compressed below 15, no insurance demand | ↑ low fear regime |
ASIC and FSCA regulation. Cent-account option for small balances. Leverage up to 1:1000 on the offshore entity for the high-leverage archetype.
Scenario map for the next 48 hours
Digestion holds
CPI prints in line, Iran tape stays loud but contained. SPX holds $7,374 on dips, fades CPI volatility within the session, and grinds back toward $7,412 by US close. Dip-buying remains the dominant flow. Tactical pause inside a structural uptrend.
Pullback extends
Hot CPI plus Iran headlines staying hot. SPX loses $7,374, reaches $7,330 to $7,300 over a few sessions. Long-duration tech leads the give-back. Energy outperforms. This is the “buy the dip” window dip-buyers are explicitly looking for.
Regime break
US military action against Iran in response to the negotiation breakdown, or an Iranian action that forces a US response. SPX loses $7,300, accelerates to $7,150 to $7,200. VIX above 22. Defensives finally see size rotation. The dip-buy pattern fails and the regime changes.
Ken’s chart and read
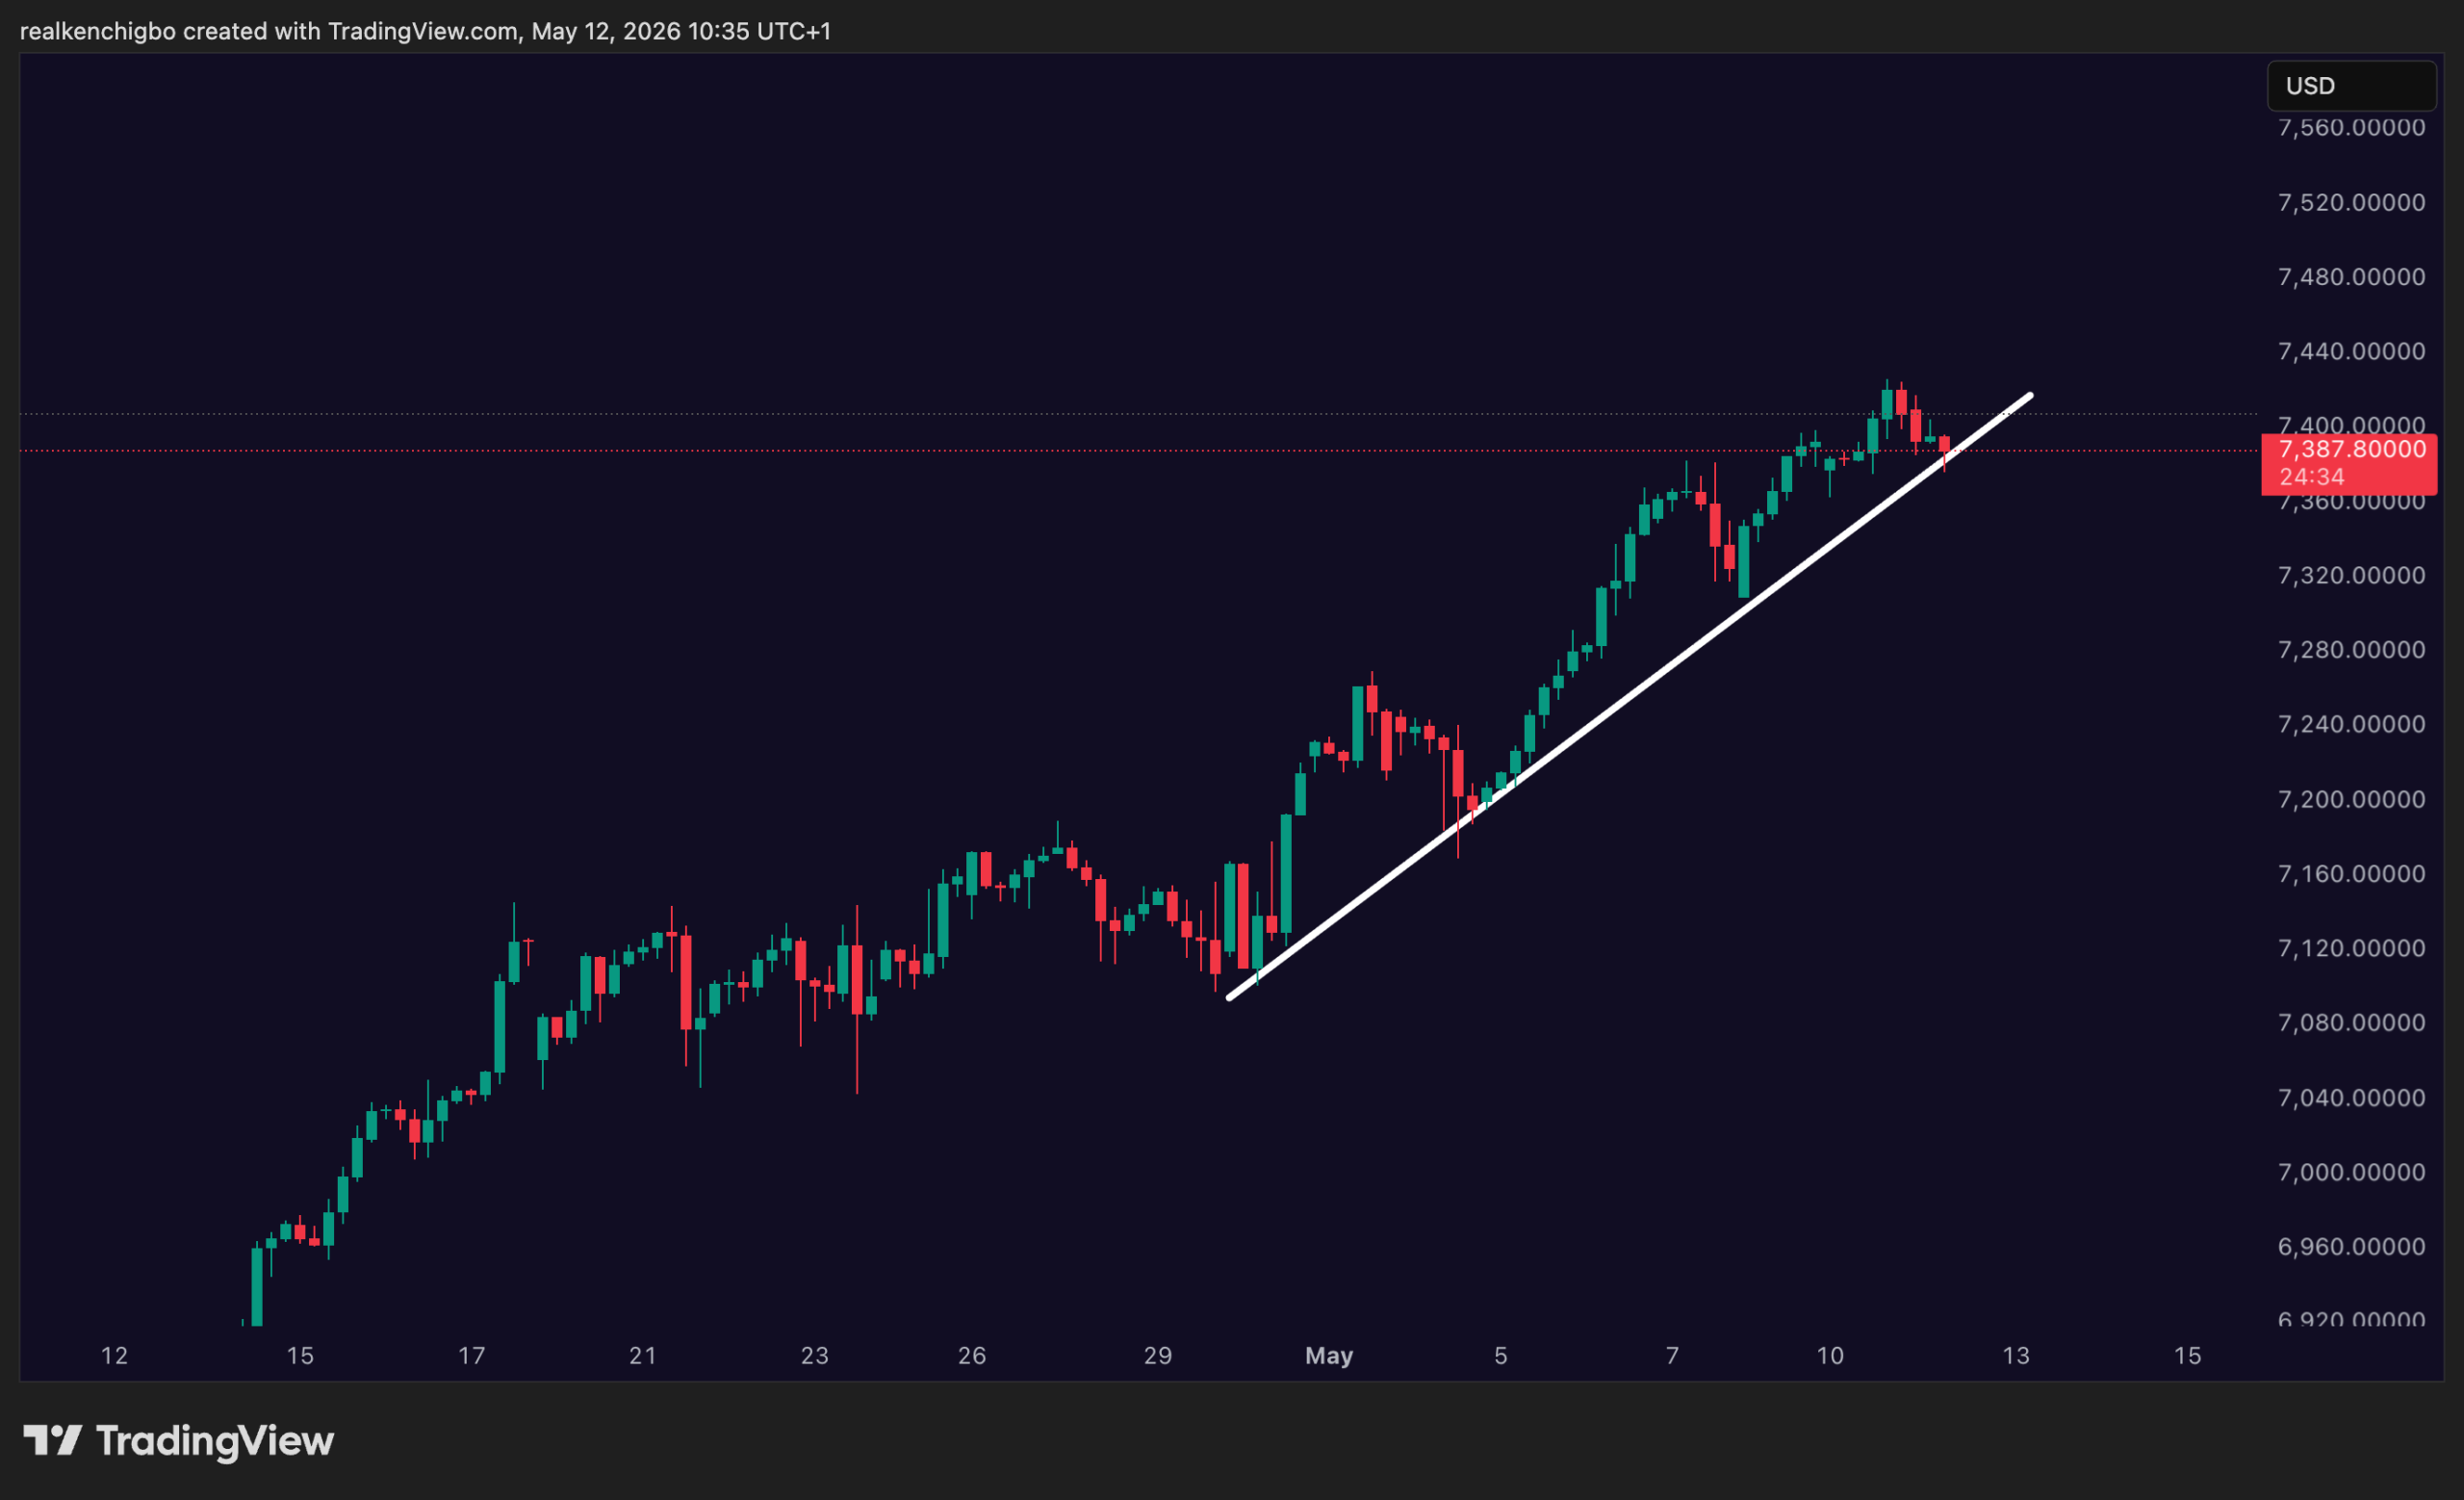
Ken’s read on the 4H
- 01Higher high, higher low phase, structure incredibly intact.The 4-hour is printing a clean sequence of higher highs and higher lows. Each leg up is held by a higher floor than the last. Until that sequence breaks, the structure is doing what an uptrend is supposed to do.
- 02Dips continue to be bought.Every leg lower on the 4H has been absorbed within a candle or two. There is a consistent bid showing up on every discount, which is the behavioural signature of an uptrend with conviction underneath it.
- 03Premium then discount, discount keeps getting taken.The tape is rotating cleanly between premium and discount inside the trend. Price pushes into premium, takes a pullback into discount, the discount is bought, and price extends. That is exactly what a trend rotation looks like when it is healthy.
- 04The 4H trendline is where mass psychology is leaning.Drawn off the late-April swing low and through subsequent higher lows, the ascending trendline is the visible line the market is trading. While that trendline holds, the path of least resistance points up. Mass psychology is anchored on it, and that is doing real work for the bulls.
- 05A clean breach of the trendline flips the read.If the trendline gets broken with a 4H close and then fails to recover on retest, the higher-low sequence is at risk and the structural picture changes. Until that happens, the structure is the structure. Watch the line, not the headline.
CPI-day index calls hit the desk Discord in real time. Live named levels, cross-asset confirmations, plain English on what is and is not a real signal.
For prop firm traders
E8 Markets · KENMACRO 5% off
Funded accounts to $400k. Profit splits to 90%. Trade SPX, NDX, gold, oil, FX through one challenge. Code KENMACRO for 5% off.
ASIC regulated. Strong mid-tier broker with competitive raw-spread accounts and full MT4 and MT5 support.
What would invalidate the bullish view
Invalidation triggers
- SPX daily close below $7,300. Breaks the 20-day SMA and the dip-buy pattern. Reframes the regime as a topping process rather than a digestion phase.
- A US military action against Iran. This is the genuine tail. Trump’s frustration with the negotiating breakdown raises the probability that a military response replaces a diplomatic one. The market is not pricing this. If it happens, the move is fast and large.
- Defensive sector rotation with size. The dip-buy pattern has been confirmed by the absence of XLP, XLU, gold-equity buying on Iran headlines. If those start to bid with size on the next geopolitical headline, the regime is changing.
- VIX above 22 with a 10-handle daily range. Compressed vol is the structural condition for the dip-buy. A real vol expansion forces vol-target funds to mechanically reduce exposure, which removes the systematic bid.
The final read
Equities are in a “guilty until proven innocent” position with respect to bears. The regime is bullish, the dip-buying is real, and every catalyst that was supposed to break the pattern over the past four weeks has failed to do so. That is not a license for complacency. The dollar is bid, oil is bid, the Fed reflex is stretched, and the Iran tail is genuinely larger than the implied vol surface is pricing. The desk’s framework: stay constructive on the index until $7,300 fails on a daily close. Above $7,300, the digestion read is intact and the upside-asymmetry that has rewarded dip-buyers all spring continues. Below $7,300, the regime has changed and the trade is to step out of the way, not to call the top.
The chart, when Ken adds it below, will show the structural pivot zone visually. Until then, the levels above are the levels. The CPI print at 13:30 BST will set the next 48 hours.
The bid keeps showing up because the mechanics support it, the earnings support it, and the Fed reflex supports it. The trade is not to fight that bid. The trade is to know what specifically would break it.
, Ken Chigbo, KenMacro Desk
In short
- S&P 500 closed $7,412.84 yesterday, Nasdaq $26,274. Today’s pullback is the first real digestion test in roughly a week.
- Dip-buying conviction is intact: systematic flow, earnings tailwind, Fed reflex. $7,374 is the level that has to hold for the pattern to continue.
- The genuine tail is a US military response to the Iran negotiating breakdown. That single event flips the regime, and the market is not pricing it.
FCA, ASIC and FSCA regulation. Lloyd’s of London supplementary client-fund insurance up to one million dollars per client. Raw-spread ECN execution.
Related reading on KenMacro
- Oil Surges Above $100 as Trump Slams Iran Ceasefire →
- How to Trade CPI: The Macro Trader’s Guide →
- How Inflation Affects Forex, Gold, and Stocks →
- Iran War Update: Where the Conflict Sits This Week →
Related from the desk
FAQ
What did the S&P 500 close at yesterday, 11 May 2026?
The S&P 500 closed at $7,412.84 on Monday 11 May 2026, its first close above the $7,400 mark, despite Trump publicly rejecting Iran’s ceasefire counter-proposal and oil clearing $100. The Nasdaq Composite closed at $26,274.13. Both indices printed fresh all-time record closing highs.
Why are stocks pulling back today, 12 May 2026?
Stocks are softer today on two reasons. First, traders are positioning for the US CPI inflation print at 13:30 BST, which is the immediate binary that resolves rate-path expectations. Second, the geopolitical risk premium from Trump’s rejection of Iran’s ceasefire proposal is being repriced through a combination of higher oil, a bid dollar, and inflation-impulse repricing. Today’s pullback is the first genuine digestion test the index has faced in roughly a week.
Is the bullish sentiment in stocks still intact?
Bullish sentiment is intact, supported by three reinforcing factors: systematic flow (vol-target funds, CTAs, risk parity all overweight equities), Q1 2026 earnings tailwind (roughly 11% blended growth, margins firm), and the Fed reflex (any inflation complication eventually triggers a dovish-pivot expectation). Defensive sector rotation has not appeared with size, which is the cleanest tell against a real risk-off regime change.
What is the key S&P 500 support level to watch?
The first defended support is $7,374, yesterday’s intraday low and the immediate dip-buy reference. Below that, $7,330 is structural (50% retrace of the late-April rally) and $7,300 is the round-number plus 20-day SMA convergence. A daily close below $7,300 breaks the dip-buy pattern and reframes the regime from digestion to topping. Above $7,374, the pattern remains intact.
How will CPI affect the stock market today?
US headline CPI consensus is 3.7% YoY (up from 3.3%), with core at 3.6%. A hot print extends the dollar bid and pressures rate-sensitive long-duration tech, with energy outperforming as the inflation impulse is confirmed. A cool print releases the rate-cut bid, lifts long-duration tech, and supports the index higher. An in-line print keeps the digestion range alive and hands the next move to the Iran tape. The desk treats the print as a three-way conditional rather than a single number.
What is the biggest risk to the stock market right now?
The genuine tail risk is a US military action against Iran in response to the negotiation breakdown, not the Iran headlines themselves. Headlines have been bought consistently. An actual military response, particularly one that triggers an Iranian counter-response or a full Hormuz closure, would force vol-target funds to mechanically reduce equity exposure, push VIX above 22, and finally trigger the defensive sector rotation that has been absent through the spring. The market is not pricing this scenario at meaningful probability.
Why are dip-buyers winning every Iran headline this spring?
The dip-buy mechanic is structural. Systematic strategies (vol-target funds, CTAs, risk parity) are mechanically long equities because realised volatility has been declining and trend filters have been positive. Earnings season delivered better-than-expected growth and margin performance. And the Fed-reflex logic has the market reading “anything that complicates the Fed’s path eventually forces a dovish pivot” as bullish for stocks. Together those create a bid that is mechanical rather than sentiment-driven, and mechanical bids do not break on a single headline.
What is the Nasdaq Composite’s key level today?
The Nasdaq Composite closed at $26,274.13 yesterday. The immediate support is $26,000 round-number plus the prior breakout reference. Below $26,000, the 50-day SMA cluster around $25,650 becomes the next defended zone. Above yesterday’s close, $26,500 unlocks measured-move extension toward $26,800 to $27,000. Long-duration tech is the most rate-sensitive sub-component of Nasdaq, so the index’s path through the day mirrors the bond market response to CPI.
Should investors buy this dip in stocks?
The desk does not publish trade recipes. The framework: the dip-buy pattern has worked all spring, the structural support is in place, and the level that has to hold is $7,374 on the S&P 500. Investors who wanted exposure and have been waiting for a pullback have one. Investors who are concerned about the Iran tail risk should size accordingly rather than fight the regime. The downside-asymmetry from a US-Iran military escalation is large enough that even bullish positioning should have a clear plan for what to do if $7,300 breaks.
What does the VIX say about market fear right now?
The VIX has been compressed below 15 throughout the rally, indicating low insurance demand and a structural low-fear regime. Compressed vol is itself the condition that supports the dip-buy: vol-target funds mechanically size up when vol is low. A spike above 22 with sustained 10-handle daily ranges would force those funds to mechanically reduce equity exposure, which is when the bid disappears. As of this writing, the VIX shows no sign of that expansion.
Sources: CNBC, Reuters, Seeking Alpha, Investing.com, CFRA Research (Sam Stovall commentary), 24/7 Wall St., SwingFish. Index closing levels reported across CNBC and Reuters wire. Iran headlines via Washington Post, NBC News, Irish Times, CBS News, PBS NewsHour, CNN.
Continue reading