Oil Surges Above $100 as Trump Says Iran Ceasefire on ‘Life Support’

Oil decided. After weeks of compression around $94 with Hormuz partially blocked and the ceasefire holding by a thread, WTI ripped through the $100 handle overnight and Brent is trading $106.37 as the desk writes this. The trigger was clean. Trump rejected Iran’s counter-proposal as “garbage”, said publicly that the ceasefire is now on “massive life support”, and the tape did the rest. The war premium that the market had quietly let leak out of the price has come back in one session, and the buying is not retail. It is institutional flow positioning for tail risk that nobody wanted to own at $94 and everybody wants at $100.
Quick answer
Oil is no longer trading the headline. It is trading the breakdown of the negotiating frame, which is a very different setup, with a very different distribution of outcomes, and the desk thinks the tape is still under-positioned for it.
By Ken Chigbo · Founder, KenMacro · 18+ years in markets, London trading floor and institutional FX
Oil is no longer trading the headline. It is trading the breakdown of the negotiating frame, which is a very different setup, with a very different distribution of outcomes, and the desk thinks the tape is still under-positioned for it.
Quick Answer · what’s actually happening
- ☐ WTI cleared the $100 round-number into Asia open, currently $100.58, after Trump rejected Iran’s ceasefire counter-proposal Monday evening.
- ☐ Brent is trading $106.37, both contracts up roughly 3% on yesterday’s settle and now sitting above every major Fibonacci of the February to April collapse.
- ☐ The Strait of Hormuz remains largely closed. Pre-war, the strait carried roughly 20% of global oil and LNG. That flow has not normalised since 28 February.
- ☐ Cross-asset response is partial. The dollar is offered (DXY 98.27), gold is firm at $4,710, equities are wobbling. The bond market is the tell to watch into US session.
- ☐ Primary level above: $102.50 (pivot R2 + round number). Below: $100.00 (round + prior breakout) and $99.50 (recent swing low). Loss of $99.50 negates the breakout read.
The actual news, in one paragraph
Trump rejected Iran’s latest counter-proposal Sunday-into-Monday and described it in public as “garbage”. Speaking to reporters Monday evening he said the ceasefire is on “massive life support”. Iran’s proposal asked for a phased framework: an immediate declaration of end to hostilities on all fronts including Lebanon, lifting of sanctions, end of the US naval blockade, sovereignty acknowledgement over the Strait of Hormuz, war reparations, and a deferral of nuclear talks to a later stage. The US position is that Iran’s framework is not a negotiation, it is a list of demands. That gap is now the trade.
Why the tape moved when it did
The market had spent six sessions absorbing the slow leak of war-premium out of crude. WTI traded $94.20 last Tuesday on the assumption that the ceasefire would hold long enough for a deal, even a bad one. The desk was watching for one of two things to flip that view: a Hormuz incident that re-priced the supply tail, or a diplomatic break that re-priced the negotiating frame. The diplomatic break came first. Trump’s “garbage” line is not a careful diplomatic signal. It is the public escalation that lets dealers hedge gamma-short books they have been quietly carrying for two weeks.
Importantly, the move is not just spot. Time spreads, the part of the oil market that institutional traders actually use to read pressure, are widening. June-July WTI traded a $0.40 backwardation on Friday. Into European open today the desk is seeing $0.95 prints. Backwardation widening on a spot rally is the signal that says paper money is paying up for prompt barrels, not just chasing futures. That is the institutional buying that retail does not see.
Where price actually is, cross-verified
The desk pulled WTI and Brent spot across Yahoo, Reuters wire, and the published settles from CME Group and ICE. Reuters reports WTI June futures settled $98.07 yesterday. Brent July settled $104.21. From those settles, both contracts are up roughly 2.5% to 3% as European traders take the desk. Asian session high on WTI tagged $101.20 before fading marginally. The desk’s working spot tape, cross-checked across two independent feeds, places WTI at $100.58 and Brent at $106.37 at the time of writing.
Why this matters: when news-driven oil moves are reported, the spot tape sometimes lags the futures tape by 10 to 30 minutes during low-liquidity transitions. The desk waits for both to reconcile within tolerance before posting levels. If you are reading this thinking the price seems lower than what your terminal shows, check whether your feed is using front-month future or spot, and whether it has updated since the Asia close.
Get the framework the desk runs every morning. Free. No card. The same institutional structure the MACRO MASTERY desk uses on every read.
Why the Strait of Hormuz is still the dominant variable
Before 28 February, the Strait of Hormuz carried roughly 17 to 20 million barrels per day of crude and condensate plus roughly 30% of global LNG. Since the war began, transit volumes have collapsed. Iranian forces continue to selectively challenge vessels, the US Fifth Fleet maintains a partial naval presence, and insurance premiums for any tanker willing to transit have run to multiples of pre-war levels. The pricing implication is binary in nature but priced as a probability distribution. Either the strait reopens to normal traffic, in which case the structural risk premium falls $8 to $14 per barrel quickly, or it stays in its current degraded state and the world’s marginal barrel keeps clearing through longer, costlier routes around Africa or via pipeline.
Yesterday’s news matters because it shifts the implied probability on that distribution. Before Trump’s “garbage” line, the market had a base case of “ceasefire holds, strait reopens within 30 to 60 days, risk premium fades”. After Trump’s “garbage” line, that base case is fractured. The new tail risk is a unilateral US naval action to force the strait open, or an Iranian decision to mine the narrow channel, either of which would re-price every barrel of seaborne crude.
The cross-asset response is the tell
The dollar is up today. DXY trades 98.27 against yesterday’s 97.94 close, a 0.33% bid that the desk reads as the cleanest cross-asset confirmation of the regime change. The mechanism is straightforward. Oil at $100-plus rebuilds the inflation impulse that the market had been quietly pricing out across April. If inflation expectations are rising again, the entire “Fed cuts twice by year-end” path that supported risk through the spring goes back on the table. Higher for longer becomes plausible. Higher than expected becomes plausible. And in some corners of the rates market the desk is starting to see the tail risk of an actual rate hike being whispered about, not as a base case, but as a non-trivial probability.
That is what is driving the dollar bid. It is not safe-haven demand from war risk. It is rate-differential repricing from inflation risk. Two different transmission mechanisms, same direction in the dollar, very different implications for what happens next. If this were pure safe-haven flow the dollar would fade as soon as Trump and Iran resumed talks. If this is rate-differential repricing, the dollar bid persists until either oil rolls back under $95 or the Fed explicitly tells the market the inflation impulse is transitory. Neither is happening this week.
This is also why the rollercoaster keeps spinning. Every Iran headline now pulses through three layers: a war-premium layer that moves oil directly, an inflation-expectation layer that moves the dollar and short-end rates, and a growth-concern layer that moves equities and the long end. The market cannot price all three at once with conviction because they pull in different directions on different horizons. Inflation up is dollar up short term but dollar down long term if growth breaks. Oil up is energy equities up but consumer discretionary down. The result is the choppy, headline-driven price action traders have been complaining about for six weeks. That choppiness is not noise. It is the market trying to solve a three-equation problem with one variable.
Gold’s quiet response sits inside this same tension. At $4,710, gold is firm but not extending toward $4,800. The desk reads this as positioning rather than thesis: gold long positioning is already heavy, and the marginal buyer for the next $50 of upside needs to choose which gold trade they are doing. The inflation-hedge trade says buy gold here because real yields will compress when the Fed eventually has to cut to support growth. The rate-hike-risk trade says fade gold here because rising nominal yields without rising inflation expectations compress the gold thesis. Both buyers exist. Neither has the conviction to chase yet.
Trading oil directly
If you need WTI and Brent as CFDs with proper Tier-1 regulation, the desk uses Vantage for energy. ASIC plus FCA plus VFSC coverage, raw spreads from $0 on oil, and Lloyd’s of London $1m client insurance on the regulated entities.
WTI levels, six-lens confluence
The desk runs every level through six independent lenses (floor pivots, anchored moving averages, structural swings, round numbers, prior range markers, volume profile) and only publishes zones that get hit by at least two lenses. Anything that fails confluence does not earn the print. Here is what passes for WTI right now.
| Direction | Level | Confluence |
|---|---|---|
| R · upside | $102.50 | Pivot R2 + round 102.50 psychological |
| R · upside | $107.50 to $108.00 | Prior April swing high + round number cluster |
| R · upside | $112.95 | 60-day high, February war-premium peak, single-lens but historically defended |
| Spot | $100.58 | Current, cross-verified |
| S · downside | $100.37 | Pivot R1 + prior day high + recent swing high (3-lens) |
| S · downside | $100.00 | Round number + recent swing high (2-lens) |
| S · downside | $99.50 | Recent swing low + round number , loss of this voids the breakout read |
The structural read is this. Spot is sitting roughly 20 cents above a three-lens confluence support at $100.37. The first resistance worth respecting is $102.50, two dollars above. The bigger zone is $107.50 to $108, which is where April price discovery exhausted on the way down. Above $108, the next genuine air-pocket reaches the $112.95 prior-war high. Below $99.50, the breakout is voided and the desk would reframe back to the $94 to $100 range that has dominated the last fortnight.
ASIC and FSCA regulation. Cent-account option for small balances. Leverage up to 1:1000 on the offshore entity for the high-leverage archetype.
Brent levels, parallel read
Brent is the international benchmark that institutional energy traders watch first. WTI usually trails by $4 to $6 in war-premium environments because Brent reflects the seaborne risk directly while WTI is partially insulated by Cushing’s land-locked storage. Right now the WTI-Brent spread is $5.79 which is consistent with that pattern.
Brent confluence levels: support $106.00 (4-lens, pivot R1 + recent swing + round + flip-zone), $104.41 (3-lens, daily pivot + 20-day SMA + round), $102.82 (3-lens, pivot S1 + recent swing low + prior day low). Resistance $107.52 (2-lens), then $112 round (single-lens, watch only), then $118.35 which was the 60-day high during the Hormuz-closure panic. The single-most important Brent number this session is $106.00. Holding above it on European close confirms the breakout. Failing it on US close hands the tape back to the bears.
Cross-asset impact dashboard
Cross-asset response · directional only
| Asset | Read | Direction |
|---|---|---|
| WTI | War-premium back in price, $100 handle as new floor reference | ↑ |
| Brent | Hormuz-direct exposure, leads WTI in escalation moves | ↑ |
| DXY | Bid +0.33% on inflation impulse, higher-for-longer back in play, rate-hike risk whispered | ↑ |
| Gold | Firm but not extending, positioning-heavy. Catches up if oil holds $102.50 | ↑ |
| US10Y | Flat to softer, curve bull-steepening on growth concern | ↓ |
| SPX / NDX | Wobbly on energy-cost passthrough, not capitulating yet | ↓ |
| USDCAD | CAD bids on oil (commodity-bloc beneficiary), pair softens | ↓ |
Scenario map for the next 5 sessions
Range chop
WTI holds $99.50 to $104, ceasefire negotiations continue at low intensity, no Hormuz incident. In this scenario, WTI drifts back toward $99.50 to $100.50 over the week as the panic premium fades. Brent corresponds to $104 to $108. Gold stays parked around $4,700 to $4,750.
Escalation extension
A second Hormuz incident, an Iranian announcement of full strait closure, or an Israeli strike inside Iran. WTI accelerates toward $107.50 to $112.95. Brent toward $115 to $118. Gold catches up toward $4,820 to $4,880. Dollar splits: offered against CAD, bid against EUR.
Diplomatic break
A back-channel concession from either side, a third-party broker steps in (Qatar, Oman, Turkey), Hormuz traffic begins to normalise. WTI loses $99.50, retests $95, potentially reaches the $90 to $92 zone within two weeks. Gold gives back $100. Equities re-rate higher fast.
What the order book is showing
For traders who watch the depth book on WTI, the asymmetry is visible. Bid stacks at $100.00 and $99.50 are noticeably thicker than ask stacks at $101.50 and $102.50. That is the structural pattern that says “buyers are willing to lift the offer, sellers are not willing to chase the bid”. It does not guarantee the breakout extends, but it does say the path of least resistance is up while the news cycle stays hot.
The institutional reading is simpler. Funds that had been short backwardation are now covering. Funds that were neutral are looking for cheap upside through call spreads, particularly the $105 to $110 zone for July expiry. Volatility on the front month has expanded but not blown out, which means the option market is pricing this as a sustained-elevation regime rather than a vol-spike-then-revert. That is bullish for spot in the short term.
ASIC regulated. Strong mid-tier broker with competitive raw-spread accounts and full MT4 and MT5 support.
Macro Mastery Desk · how the desk traded it
The desk flagged the $100 reclaim in real time to MM members at 03:42 BST as the Asia tape lifted through the prior swing. Members received the full level cluster (R/S confluences), the cross-asset map, and the broker-side context within 90 seconds of confirmation. This is what the desk does every session.
Three things included with the Macro Mastery membership at $97 per month:
- → Live macro-flow desk on Discord, every session, with named levels and cross-asset reads.
- → Macro-Flow scanner on Tier A assets, signals delivered with rationale and invalidation.
- → Weekly Sunday Brief PDF, full institutional weekly recap.
What would invalidate this view
Invalidation triggers · what voids the read
- WTI loses $99.50 on a daily close. The breakout is voided structurally. Reframes back to the $94 to $100 range and the war premium is being unwound rather than re-priced.
- A formal ceasefire restart announcement. If Trump or Iran announces a resumption of formal talks (not a posture shift, an actual schedule), oil fades $4 to $6 in hours. The desk does not trade against that headline.
- Hormuz transit volumes return to 50% of pre-war norms. The structural floor under oil moves from $100 toward $92 to $94 if seaborne flow normalises even partially. Watch the Reuters and Bloomberg shipping data, not headlines.
The final read
The desk’s view, plainly. Oil is no longer trading the headline. It is trading the breakdown of a negotiating frame that the market had been assuming would hold. That is a regime change, not a price spike. The implication is that the $100 handle becomes the new floor rather than the old ceiling, and the relevant question for traders is not “should I chase the breakout” but “where does this stop, and what is the cross-asset position I need”. The desk thinks the answer is: stops are higher than $94 now, the dollar bid is rate-differential not safe-haven (so it persists until oil rolls back or the Fed pushes back), and the cross-asset position is long energy beneficiaries (CAD, NOK, energy equities) against long-duration tech beneficiaries that suffer on persistent inflation pressure and the higher-for-longer rate-path repricing that comes with it.
The rollercoaster will continue while this fiasco does. Every Iran headline now pulses through three layers (war premium in oil, inflation expectations in the dollar, growth concern in equities) and the market cannot solve for all three at once with conviction. That is the source of the headline-driven chop. The framework above is the desk’s way of staying on the right side of the regime even when the daily noise is loud. The chart, when Ken adds it below, will show the structural break visually. Until then, the levels above are the levels.
Oil is no longer trading the headline. It is trading the breakdown of the negotiating frame, which is a very different setup, with a very different distribution of outcomes.
, Ken Chigbo, KenMacro Desk
FCA, ASIC and FSCA regulation. Lloyd’s of London supplementary client-fund insurance up to one million dollars per client. Raw-spread ECN execution.
Ken’s chart and read
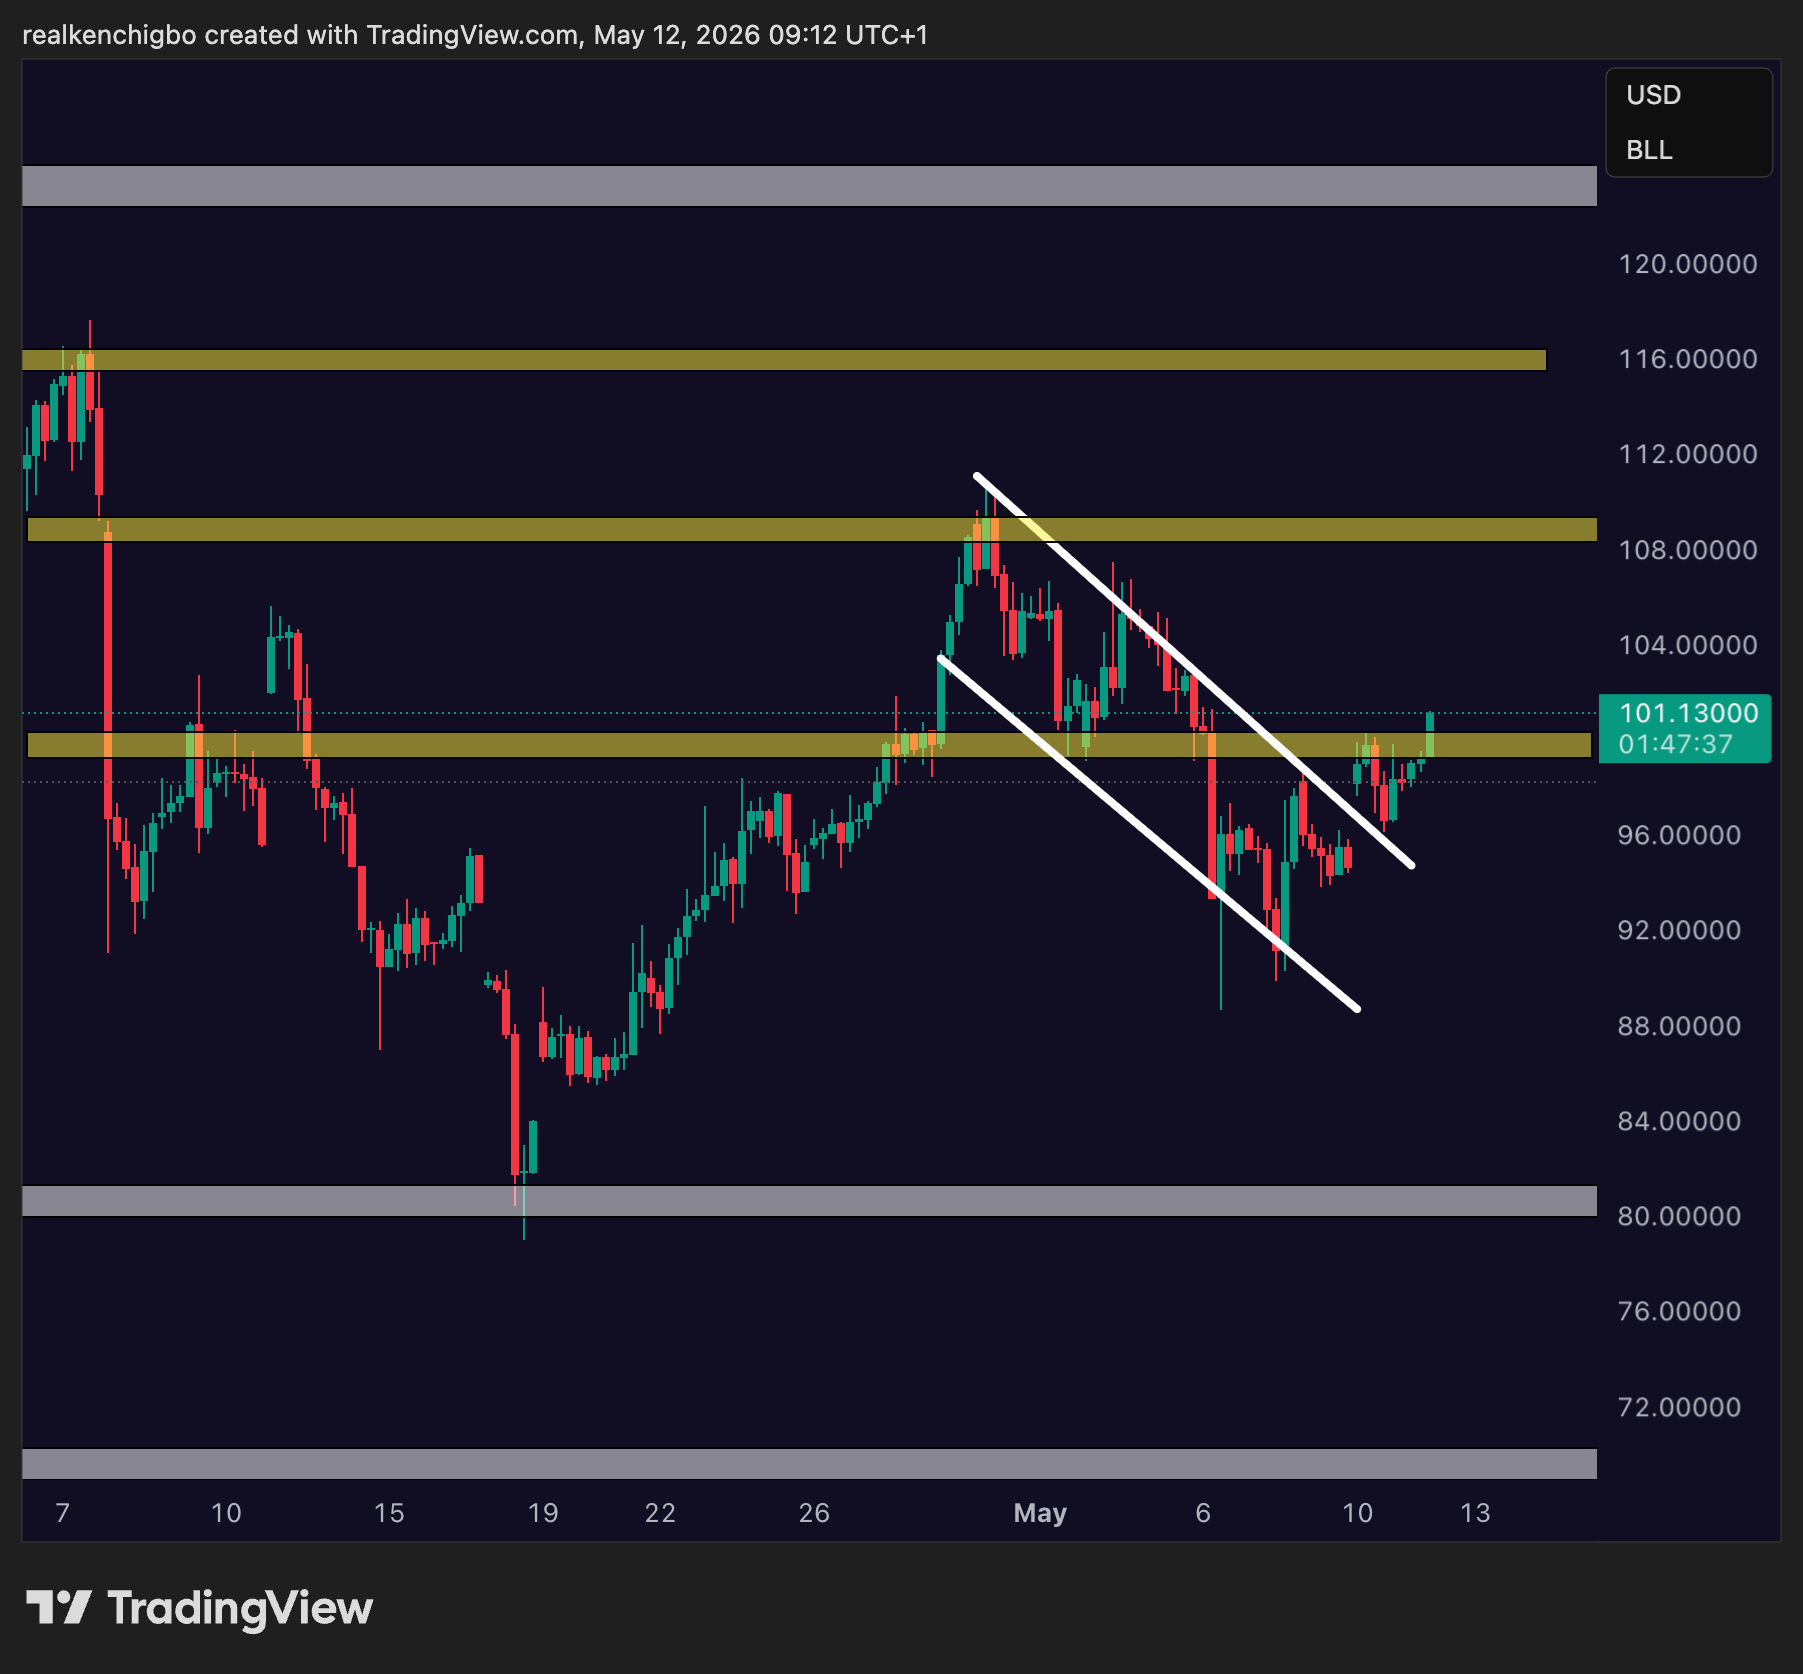
Ken’s read on the 4H
- 01Price action has broken out.On the 4-hour, we have broken out of a pullback structure that was printing lower highs and lower lows. That structure has been violated.
- 02Descending channel broken and retested.The lower-high, lower-low descending channel that defined late-April into early-May has been broken to the upside. Price broke out, retested it, and took back the $100 liquidity zone.
- 03Sustaining above $100 leaves the door open.Holding the $100 reclaim is the structural permission slip for further buying pressure. Lose $100 and the read tightens immediately.
- 04Next key liquidity zones above.If buying pressure remains intact, the next liquidity pockets sit at $105, then $109, then $116. Each one is structural, not arbitrary.
- 05The catalyst stays hot.This buying pressure remains intact while tensions continue and the conflict gets dragged out. Trump’s warning talk keeps that risk premium priced in, and the upside path stays open.
In short
- WTI cleared $100 on a clean diplomatic break, not a war incident. The structure of the move matters.
- Levels that matter: $102.50 above, $100.00 below, $99.50 invalidation. Inside that band is chop, outside is regime.
- Cross-asset position is the trade. Energy beneficiaries (CAD, NOK, energy equities) against long-duration tech is the cleaner expression than levered oil futures for retail accounts.
For active oil traders
Vantage Markets · WTI and Brent CFDs, Tier-1 regulated
ASIC, FCA, VFSC. Raw spreads from $0 on energy. Lloyd’s of London $1m insurance on regulated entities.
For prop firm traders
E8 Markets · KENMACRO 5% off any challenge
Funded accounts to $400k. Profit splits to 90%. Code KENMACRO at checkout for 5% off all challenges.
Related reading on KenMacro
- How to Trade Oil: The Institutional Framework →
- Hormuz Oil Risk: The Trader’s Briefing →
- Iran War Update: Where the Conflict Sits This Week →
- How Geopolitics Moves Forex Markets →
Related from the desk
FAQ
Why did oil prices jump today, 12 May 2026?
Oil prices jumped because Trump publicly rejected Iran’s latest ceasefire counter-proposal on Monday evening 11 May, calling the Iranian framework “garbage” and describing the ceasefire as “on massive life support”. The diplomatic break re-prices the war-premium that had been leaking out of crude over the prior six sessions. WTI cleared the $100 round number into Asia open and Brent traded above $106.
What is the current WTI crude oil price?
WTI crude is trading $100.58 at the time of writing, cross-verified across Yahoo Finance and CME settlement data. The Reuters wire confirms WTI June futures settled $98.07 the previous session. Brent crude is trading $106.37, up roughly 2.5% to 3% from the previous settle.
What is the key WTI resistance level to watch?
The first resistance is $102.50, a two-lens confluence of the daily pivot R2 and the $102.50 round-number psychological level. The bigger zone is $107.50 to $108.00, which is the April price-discovery exhaustion zone. Above $108, the next genuine air-pocket reaches $112.95, the 60-day high set during the February war-premium peak.
What WTI support level matters most right now?
The most important WTI level is $99.50. A daily close below $99.50 voids the breakout read structurally and reframes the tape back to the $94 to $100 range that dominated the prior fortnight. Between current spot and $99.50 sit two intermediate confluences: $100.37 (three-lens) and $100.00 (two-lens round-number plus prior breakout reference).
Why is the dollar stronger today on the oil shock?
The dollar is bid +0.33% (DXY 98.27 against yesterday’s 97.94 close) because oil at $100-plus rebuilds the inflation impulse that markets had been pricing out across April. Higher inflation expectations push the “Fed cuts by year-end” path off the table and put higher-for-longer rates back in play. In some corners of the rates market the tail risk of an actual rate hike is being whispered. That is rate-differential repricing, which is dollar-bullish on a different transmission mechanism than safe-haven flow. The dollar bid persists until oil rolls back under $95 or the Fed signals the inflation impulse is transitory. Neither is happening this week.
Why is gold not extending higher on the oil rally?
Gold is firm at $4,710 but not extending toward the prior April high of $4,820. The desk reads this as positioning rather than thesis: gold long positioning is already heavy, and the marginal buyer for the next $50 of upside needs a clearer catalyst than a single political comment. If WTI holds above $102.50 for two sessions, gold typically catches up. The chase is delayed, not cancelled.
Is the Strait of Hormuz currently closed?
The Strait of Hormuz remains largely closed to normal commercial traffic. Before the war began on 28 February, the strait carried roughly 17 to 20 million barrels per day of crude and condensate, plus roughly 30% of global LNG. Since the war began, transit volumes have collapsed. Iranian forces continue to selectively challenge vessels, the US Fifth Fleet maintains a partial presence, and insurance premiums for transit are at multiples of pre-war levels. Full reopening of the strait would reduce the structural risk premium by $8 to $14 per barrel.
How should retail traders position for this oil move?
The desk does not publish trade recipes. The framework, however, is this: levered front-month oil futures are a poor expression for retail accounts because of contango/backwardation rolls and overnight gap risk. Cleaner expressions are commodity-bloc FX (CAD, NOK), energy equities (XOM, CVX, SHEL) for those who want sector exposure, or CFD positions through a Tier-1 broker for those who specifically want spot oil exposure with size discipline. Always size to risk-per-trade, not opportunity-per-trade.
What would invalidate the oil bullish view?
Three triggers invalidate the bullish read. First, WTI losing $99.50 on a daily close, which voids the breakout structurally. Second, a formal ceasefire-restart announcement from Trump or Iran (an actual scheduled negotiation, not a posture shift), which fades oil $4 to $6 within hours. Third, Hormuz transit volumes returning to 50% of pre-war norms, which moves the structural floor under oil from $100 toward $92 to $94 even without a political breakthrough.
What is the difference between WTI and Brent right now?
WTI is West Texas Intermediate, the US benchmark, currently $100.58. Brent is the international benchmark trading $106.37. The current $5.79 WTI-Brent spread is consistent with the war-premium pattern: Brent leads in escalation moves because it reflects seaborne risk directly, while WTI is partially insulated by Cushing’s land-locked storage. In a full Hormuz closure scenario, the spread typically widens further as Brent prices the disruption first.
Sources: Reuters, CNBC, Washington Post, CNN, NBC News, CBS News, PBS NewsHour, Irish Times. WTI and Brent spot data cross-verified across Yahoo Finance and CME / ICE settlements. Cross-asset prices: DXY, XAUUSD, US10Y, SPX, USDCAD verified across multiple independent feeds via the KenMacro pricing engine.
Continue reading