Gold Price Today: 4750/4650 Range Pre-Explosive Breakout
Open Vantage →
The desk’s three-broker stack
Pick the broker that matches your priority. Vantage for Tier-1 regulation plus Lloyd’s $1m insurance. E8 Markets for funded trader capital with KENMACRO 5% off any challenge.
Quick answer
Gold Price Today Iran Hormuz Project Freedom May 2026: the short answer from the KenMacro desk. Gold price today, $4,690 spot, coiled in a tight $100 range between 4750 supply and 4650 demand. The desk's read on the breakout setup, real-yields lens and where the levels matter most.
Capital at risk. CFD and margin trading carry significant risk of loss. Past performance does not guarantee future results.
Gold did not break. It bent. Yesterday's CPI print was supposed to be the catalyst that finally unwound the bullion bid. The tape said otherwise. By the time New York closed, gold had tested the prior-week extreme, reverted toward the 4700 round, and the same desks that have been fading every dip since the Hormuz escalation stepped back in. The gold post-CPI tape is doing exactly what the 2022 setup said it would, and the desk wants you reading it the same way.
The desk's range read: $100 coil before the explosive break
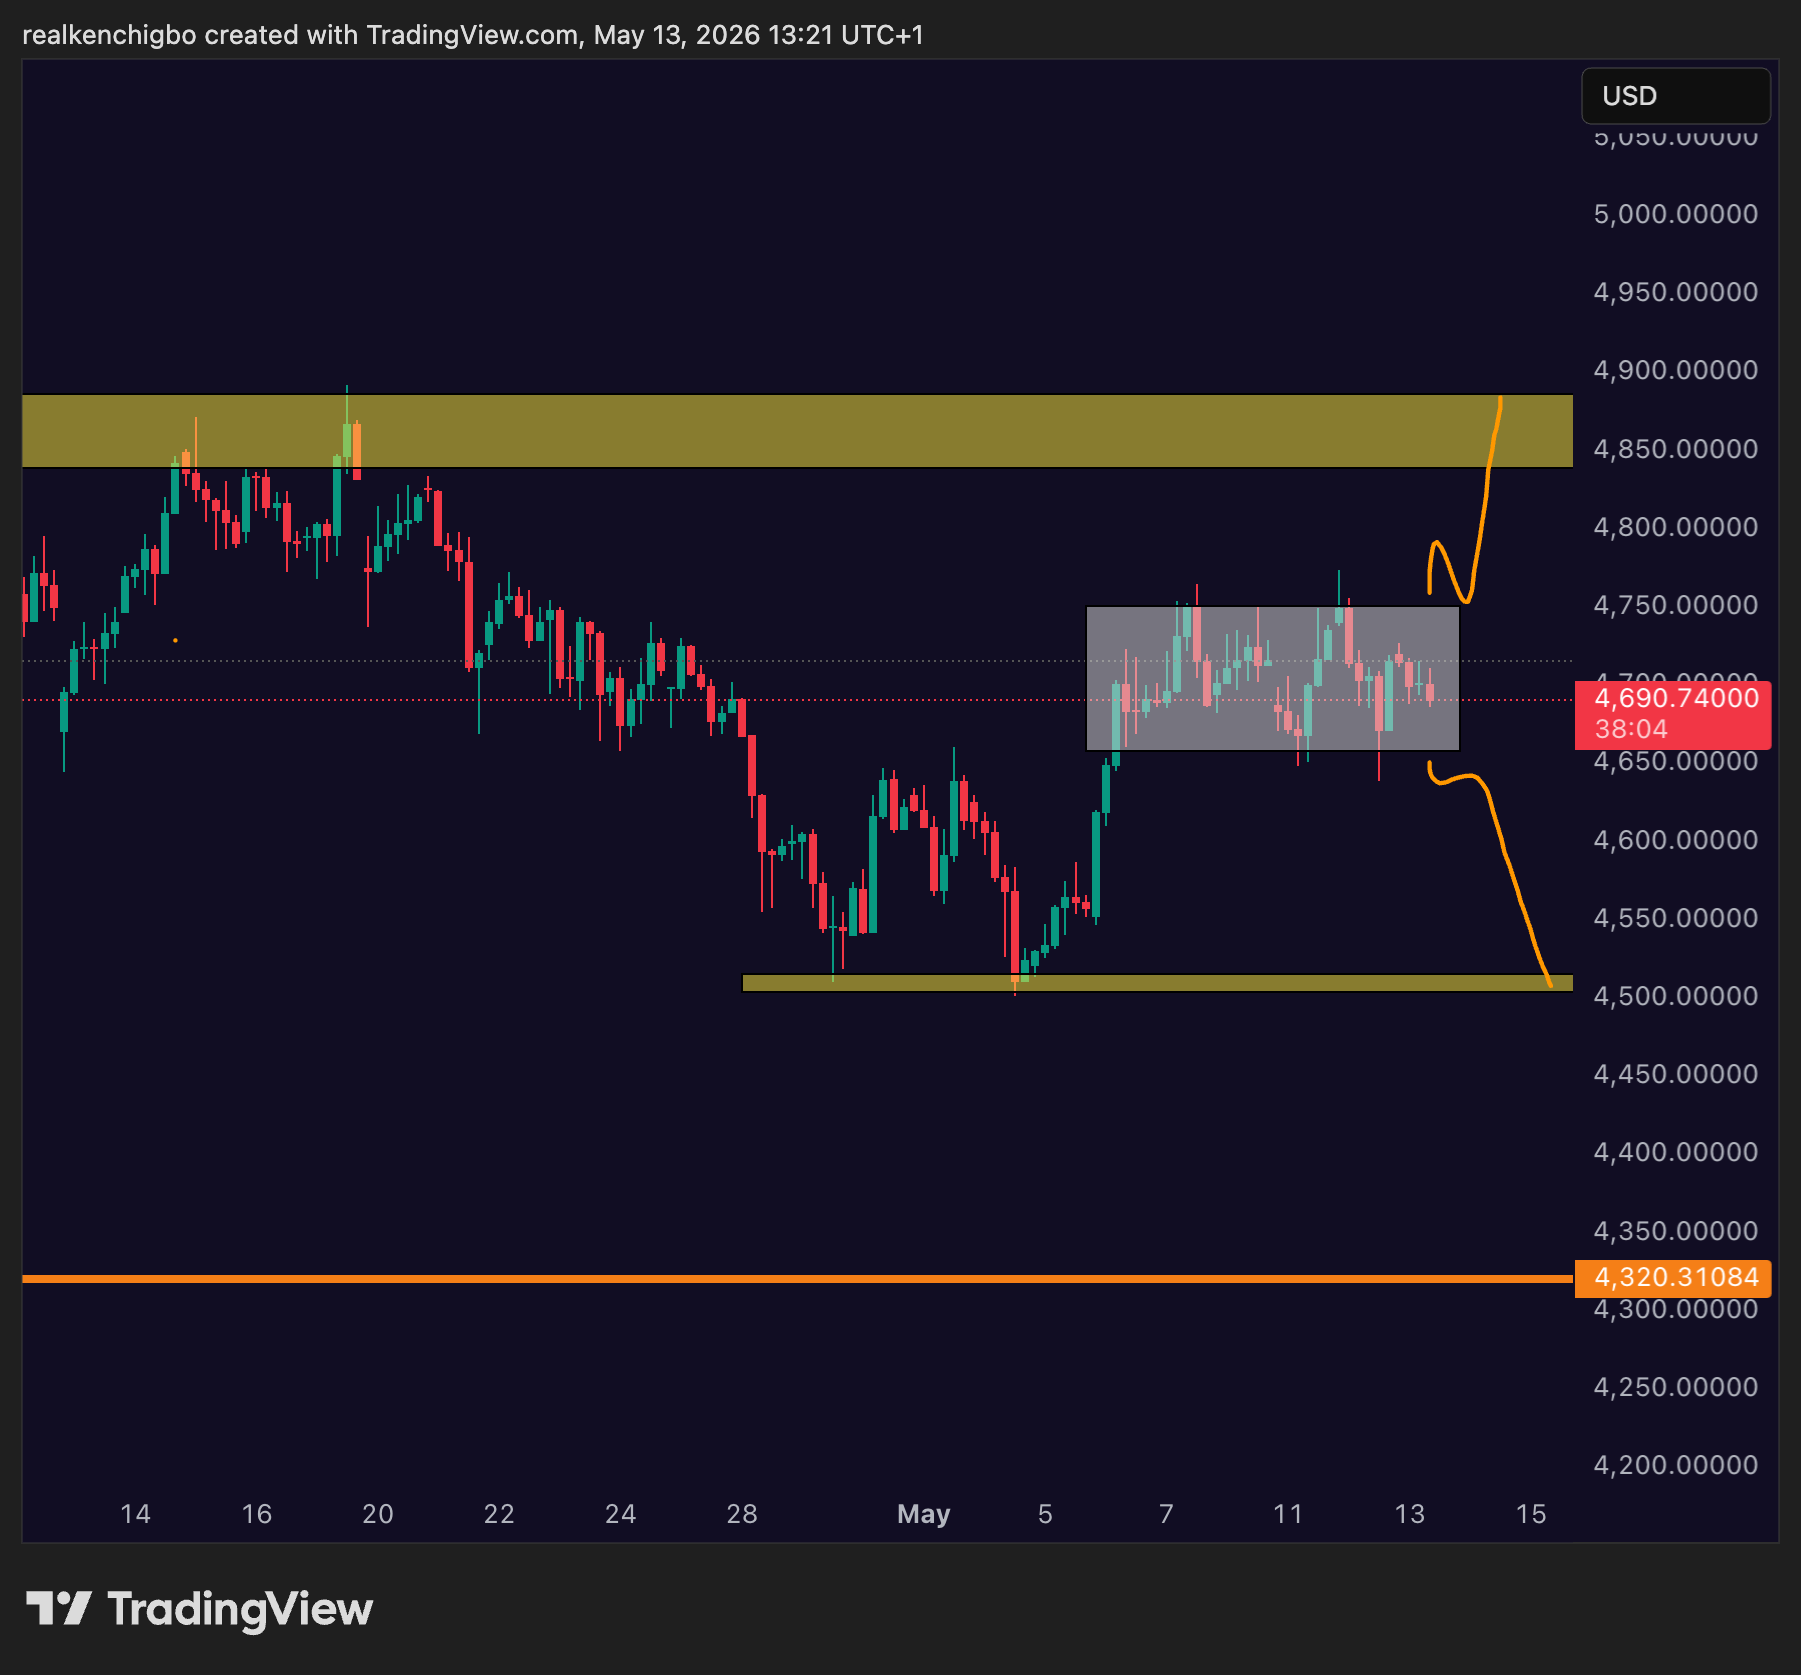
Gold has compressed into a tight $100 range, capped to the upside at 4,750 and floored to the downside at 4,650. Spot is mid-range at $4,690.74. The desk reads this as a market indecisive after the CPI print, with real-yields whipsawing and the Iran/Hormuz war-premium sitting unchanged in the background. Indecision at this kind of named level cluster does not last. The squeeze is the setup, the break is the trade.
The bracket levels are not arbitrary. The 4,750 cap is the prior-week high that has been defended on three separate touches since last Wednesday. The 4,650 floor is the H4 supply-flip-to-support shelf where the institutional bid stepped in on the dip-buys of recent sessions. Levels with multiple touches inside a tight range become the most-watched bracket on the tape, and when the tape eventually breaks one of them the move tends to extend rather than mean-revert. Tight-range compression begets expansion.
What is the institutional read of the break? Above 4,750, the next named level is the 4,850 supply zone, the spike high from earlier this cycle that capped the prior advance. That is roughly a 2.1 per cent move from the current bracket, the kind of distance that allocates real dollar-PnL to anyone positioned for the break. Below 4,650, the structural shelf is at 4,500, the demand line where every recent pullback has been bought. A break of 4,650 that takes out the 4,500 shelf would be a regime change, not a noise move; the deeper level beyond that is the 4,320 horizontal that has not been tested since early April.
The five-lens cross-asset framing supports the squeeze pattern. Real yields are oscillating around the post-CPI level with the 10-year TIPS yield bracketed; DXY is also coiled with the 100-handle as its own named pivot; and the Iran/Hormuz war-premium is in a holding pattern with no headline catalyst into NY today. Three coiled cross-asset patterns mean the gold range is not a one-asset compression, it is a wider market-wide indecision. That is exactly the regime that resolves explosively once any one of the four (gold, DXY, real yields, Iran tape) breaks first.
- 4,750 , prior-week high defended three times. The bracket cap. Break + close above triggers the upside extension scenario.
- 4,850 , prior-cycle supply spike. First named target if 4,750 cracks.
- 4,650 , H4 supply-flip-to-support shelf. The institutional bid zone of recent sessions. Range floor.
- 4,500 , structural daily demand shelf. Regime-change level if 4,650 cracks.
- 4,320 , deep horizontal, untested since early April. The fail-deep scenario.
By Ken Chigbo · Founder, KenMacro · 18+ years in markets, London trading floor and institutional FX
QUICK ANSWER
- ☐ Gold at 4708.6 (Yahoo Finance, 13 May intraday) is sitting just above the 4700 round support, with the prior-week high acting as ceiling.
- ☐ The CPI print moved real yields but not enough to break the Hormuz war-premium decomposition embedded in price.
- ☐ DXY at 98.466 is bid, yet gold is not selling off, the classic tell that the bid is geopolitical, not dollar-channel.
- ☐ The H4 supply shelf from last week has flipped to demand, defended twice on the post-CPI retest.
- ☐ Silver at 88.07 (+3.45%) is leading the precious complex, a clean signal that the bid is structural, not speculative gold-only flow.
- ☐ The level the desk is watching: 4700 round below, prior-week high above. The break of either flips the regime.
- ☐ Real yields and the Fed's terminal-rate path are the slow lever. Hormuz headline risk is the fast lever sitting on top.
JUMP TO SECTION
- What actually happened in yesterday's session
- The CPI print and the real-yields channel
- Why DXY strength didn't crush gold
- The Hormuz war-premium decomposition
- Anatomy of the dip-buy: who's stepping in
- The silver tell and the precious-complex read
- Cross-asset impact dashboard
- Scenario map into NY today
- Key levels worth watching
- What would invalidate this view
- Final takeaway
What Actually Happened In Yesterday's Session
The CPI print landed on the tape at 13:30 London, and the first 90 seconds did what every CPI print does: a violent two-way flush that took out both the prior-hour high and the prior-hour low before anyone had a chance to read the internals. That's the noise. The signal came twenty minutes later.
Gold ripped toward the prior-week high, stalled, and then unwound roughly half the post-print move over the next four hours. By NY close, the metal was holding into the 4700 zone, with the spread tightening into the European bell. That tape behaviour matters. It tells you the print was digested, the algos had their fun, and the slower, larger flow took the wheel. The desks that have been buying every dip in gold since the Hormuz escalation broke into the news cycle did exactly the same thing yesterday, on schedule.
The number this morning is gold at 4708.6 (Yahoo Finance, 2026-05-13 intraday). Silver at 88.07 (+3.45%, Yahoo Finance). DXY at 98.466 (+0.18%). The dollar is bid. Gold did not sell off. That single fact is the whole article in one observation, and the rest of this piece is the unpacking of why.
The CPI Print And The Real-Yields Channel
Gold's fair-value model is, at its core, a real-yields trade. When real yields rise, the opportunity cost of holding a non-yielding asset goes up, and the model says gold should fall. When real yields fall, the model says gold should rise. This relationship has held cleanly since the early 2010s, and it's the framework most institutional desks use to anchor their bullion exposure. We have written the full mechanism out in real yields explained, and it's the foundation of any serious gold view.
The CPI print yesterday was the kind of number that should have moved real yields meaningfully. It did, briefly, but the move was not large enough to dislodge the embedded war-premium component in gold. That's the decomposition the desk has been writing about for weeks. Spot gold is currently trading at a level that, on a pure real-yields model, would imply a fair value somewhere below where it is. The difference is the geopolitical risk premium, and the CPI print didn't touch that.
Furthermore, the Fed's terminal-rate repricing is the slow lever in this regime. Each CPI print, each NFP, each PCE release nudges the OIS curve a few basis points one way or the other, and the cumulative drift over weeks shapes where real yields settle. The fast lever, by contrast, is sitting on top of the curve: Hormuz, tanker traffic, Strait closure risk, regional headline flow. The full live read on this is the kind of thing that drops daily inside the MACRO MASTERY desk, where the war-premium decomposition is updated every session.
The read from the print: enough hawkish drift to tighten the OIS curve a touch, not enough to unwind the geopolitical bid. Real yields drifted, gold absorbed, the spread held.
Get the framework the desk runs every morning. Free. No card. The same institutional structure the MACRO MASTERY desk uses on every read.
Why DXY Strength Didn't Crush The Gold Post-CPI Tape
Here's where the tape gets interesting. DXY at 98.466 is bid on the day. EUR/USD at 1.1721 (-0.50%), GBP/USD at 1.3507 (-0.72%), USD/JPY at 157.742 (+0.32%). The dollar is firm against the entire G10 complex. On a normal day, with no geopolitical overlay, that DXY profile would be a clean headwind for gold. We'd expect the metal to fade with the euro and sterling.
It didn't. Gold is up 0.66% on the session. That divergence is the cleanest read you'll get on what's actually pricing the bullion bid right now. When gold rallies into a stronger dollar, the dollar channel is not the driver. Something else is. That something else, on this tape, is the war premium plus a structural central-bank-buying flow that has been visible in the World Gold Council data for three quarters running.
The dollar smile theory framework helps here. We're in the left side of the smile, where risk-off bids the dollar AND bids gold simultaneously. That's a regime where the two assets stop being inversely correlated and start being co-bid as twin safe havens. It happens rarely. It's happening now. The gold post-CPI tape is confirming it.
By contrast, in a clean disinflation-priced-in regime, you'd expect DXY soft, gold soft, equities firm, and the carry trades working. The cross-asset board doesn't match that. USD/JPY firm, gold firm, silver up 3.45%, equities mixed. That's not a clean disinflation tape. That's a defensive bid on top of a hawkish-drift Fed expectation, and the gold post-CPI tape is the cleanest expression of it.
The Hormuz War-Premium Decomposition
We have been tracking the Iran/Hormuz tape since the escalation cycle began, and the full chronology lives in the Iran war update 2026 coverage. The relevant point for today is this: the war premium embedded in gold is not a single number. It's a probability-weighted distribution.
The market is pricing some non-zero probability of a Strait of Hormuz closure event, partial or full. It's pricing some probability of further regional escalation. It's pricing some probability of de-escalation through diplomatic channels. Each of those branches has a price-impact estimate attached to it by the bigger desks, and the weighted sum sits on top of the real-yields fair value to give you the current spot.
WTI at 102.01 and Brent at 107.86 are the cleanest tell on how that distribution is shifting. Both crudes have been holding above the 100 round, which is itself a structural level (the round that capped the 2022 war-premium spike on the way down). When crude holds 100 with the Strait open and tanker traffic flowing, the market is saying the premium is sticky. The desk's read is that this stickiness is the foundation of the gold bid, and any decay in oil premium will read directly through into bullion.
The MACRO MASTERY desk caught a clean read on this regime last week when the same decomposition framework called the rejection at the prior-week high in real time. The framework is in the desk's archive, with the full breakdown of how to size the war-premium component against the real-yields fair value.
Anatomy Of The Dip-Buy: Who's Stepping In
Every dip in gold over the past three weeks has been bought. That's not a guess, that's a tape observation. The question is who, and at what level.
The desk's read, from watching the H4 chart and the spread behaviour at named levels, is that the bid has two distinct sources. The first is the central-bank-buying flow that the World Gold Council has been documenting. It's slow, it's price-insensitive within a wide band, and it tends to step in at round numbers like 4700, 4600, 4500. The second is the macro hedge-fund overlay that sized up after the Hormuz escalation. That bid is more sensitive to level, and it has been concentrating at the H4 supply shelf that formed in the post-escalation drift.
That shelf has now flipped. The level that was acting as supply two weeks ago is the level that defended the post-CPI retest yesterday. When a supply shelf flips to demand and gets defended on the first test, that's a structural read, not a noise read. It tells you the larger flow has positioned and is willing to absorb whatever the print throws at it.
The full mechanics of how to read this kind of flip, including the five-lens framework that ties the macro to the order flow, is unpacked in detail inside the MACRO MASTERY desk. The educational coverage in how to trade gold XAU/USD 2026 walks through the structural framework for the metal in this regime.
The Silver Tell And The Precious-Complex Read
Silver at 88.07, up 3.45% on the session. That's the move that tells you the precious-complex bid is structural rather than gold-specific.
When gold rallies alone, it's usually a single-asset flow story: a large fund rotating, an ETF inflow, a specific narrative. When silver outperforms gold to the upside, particularly with this kind of magnitude, the read changes. Silver is a higher-beta version of the precious thesis. It rallies harder when the bid is on, sells off harder when the bid lifts. A 3.45% session in silver, against a 0.66% session in gold, is the kind of gold-silver ratio compression that historically signals the trade has broader participation than just the macro-hedge community.
The desk has been watching the GSR (gold-silver ratio) as a confirming indicator for the bullion regime. When the ratio is compressing while gold is at or near highs, that's the strongest version of the bid. When the ratio is expanding while gold is at highs, the rally is narrower and more vulnerable to a flush. Yesterday's tape was the former. That's a healthy precious-complex print, and it's a meaningful tell for how today should resolve.
Cross-Asset Impact Dashboard
| Bearish / Lower ↓ | Bullish / Higher ↑ |
|---|---|
| ↓ EUR/USD 1.1721 (-0.50%) | ↑ XAU/USD 4708.6 (+0.66%) |
| ↓ GBP/USD 1.3507 (-0.72%) | ↑ XAG/USD 88.07 (+3.45%) |
| ↓ NZD/USD 0.5932 (-0.56%) | ↑ DXY 98.466 (+0.18%) |
| ↓ VIX 17.92 (-0.39%) | ↑ USD/JPY 157.742 (+0.32%) |
| ↓ WTI 102.01 (-0.17%) | ↑ Brent 107.86 (+0.08%) |
The read of this dashboard: dollar firm, gold and silver firm with silver leading, equities mixed but holding, vol contained. That's a "defensive bid on top of hawkish drift" regime, not a "risk-off rotation" regime. The distinction matters for how you read every subsequent print.
ASIC regulated. Raw-spread ECN execution. Built for active intraday forex and index traders who care about cost per round-turn.
Asset-By-Asset: What's Currently Priced
| Asset | What's Priced | Direction |
|---|---|---|
| XAU/USD 4708.6 | War-premium intact, real-yields drift absorbed, central-bank bid steady | Held the bid |
| XAG/USD 88.07 | Higher-beta precious bid, GSR compressing, structural participation | Leading the complex |
| DXY 98.466 | Mild hawkish drift from CPI internals, left-side dollar-smile regime | Firm, range-bound |
| WTI 102.01 / Brent 107.86 | Hormuz premium sticky, 100 round defended, tanker traffic open | Premium intact |
| USD/JPY 157.742 | Hawkish-drift Fed plus BoJ patience, carry intact above the 0.50 round handles | Firm |
Scenario Map Into NY Today
Three scenarios into the New York session, weighted by what the tape is telling us.
Scenario 1: Bid holds, drift higher (45%)
In this scenario, the same dip-buy flow that defended the H4 supply-turned-demand shelf yesterday steps in again on any pullback toward the 4700 round. Real yields stay range-bound, the Hormuz premium stays sticky, and gold drifts toward the prior-week high. The level the desk is watching above is the prior-week extreme, which has acted as a ceiling on two separate tests this week. Silver in this scenario tends to lead, with the GSR continuing to compress.
Scenario 2: Range, neither side wins (35%)
The tape oscillates between the 4700 round below and the prior-week high above. No catalyst, no resolution. DXY holds its current bid, real yields drift sideways, and the war-premium decomposition stays exactly where it is. This is the most boring scenario and historically the most common in the 24 hours after a major print. The desk's experience is that range-after-print resolves on the next session's London open, not the same NY session.
Scenario 3: Bid breaks, flush toward 4600 (20%)
The CPI internals get a second look from the OIS market, real yields nudge meaningfully higher, and DXY breaks above its current consolidation. In that combination, the 4700 round fails, and the next clean liquidity below is the 4600 round, which is also the rough zone of the prior month's value-area edge. The desk's read is that this scenario requires either a hawkish Fed speaker on the tape today or a clean de-escalation headline out of the Strait. Without one of those, the 4700 holds.
The framework underneath these scenarios, including the daily-routine dashboard that updates the weighting after every print, is the kind of work that gets done live inside the MACRO MASTERY desk every morning.
Key Levels Worth Watching
KEY LEVELS
- ☐ XAU/USD 4700 round support. The natural $100 round, defended on the post-CPI retest yesterday, also the rough zone of the H4 supply-turned-demand shelf. First level of liquidity below current price.
- ☐ XAU/USD prior-week high. Tested twice this week without conviction breakout, acts as the ceiling on the war-premium-intact scenario. First clean liquidity above current price.
- ☐ XAU/USD 4600 round. The next $100 round below the current zone, also the rough alignment with the prior-month value-area edge. The level a break of 4700 unlocks.
- ☐ XAG/USD 88 round. Silver's natural $1 round handle, currently the GSR-compression signal level. If silver holds above and gold holds above 4700, the precious-complex bid stays structural.
- ☐ DXY 98.50 round handle. The DXY 0.50 round just above current spot. A break above sets up the test of the next 0.50 round at 99.00, which would be the cleanest threat to the gold bid through the dollar channel.
- ☐ WTI 100 round. Structural round below, the level that capped the 2022 war-premium fade. While crude holds above, the Hormuz premium in gold stays sticky.
- ☐ USD/JPY 157.50 round. The 0.50 handle, the level that has been acting as a magnet for the post-print carry trade. Holding above keeps the dollar-smile left-side regime intact.
Live Desk Coverage Of This Setup
The MACRO MASTERY desk is covering today's NY session live, including the war-premium decomposition update and the H4 level read on gold. Same stack a hedge-fund analyst runs every morning.
The Real-Yields Mechanism In Plain English
For readers new to the framework, here's the mechanism in plain English. Real yields are nominal Treasury yields minus expected inflation. When the 10-year Treasury yields 4.3% nominally and expected inflation is 2.5%, the real yield is roughly 1.8%. That 1.8% is the risk-free real return an investor gives up to hold gold instead of a Treasury.
When real yields rise, that opportunity cost goes up, and on a pure model basis gold should fall. When real yields fall, the opportunity cost compresses, and gold should rise. The relationship is not 1:1, the model has noise, but the directional read has held for two decades. The full breakdown of the mechanism, including the lag structure and the regimes where the model breaks, is in real yields explained.
The Federal Reserve publishes the real-yield series daily through the Federal Reserve H.15 release, and the FRED database makes it available on a clean time series. The desk uses the 10-year TIPS yield as the workhorse benchmark, with the 5-year for the shorter-end repricing read. Yesterday's CPI print nudged the 10-year TIPS yield, but not by a magnitude that would, on the historical regression, generate more than a $20-$30 move in gold. The metal moved less than half that, which is itself a signal: something is absorbing the real-yields impulse, and that something is the war premium.
War-Premium Mechanics And The Hormuz Distribution
The Strait of Hormuz carries roughly 20% of global oil traffic on a typical month. The market's pricing of any disruption to that flow has historically been the cleanest single driver of crude in elevated geopolitical regimes, and crude prices feed into bullion through two channels: the direct inflation-expectations channel (higher crude tends to raise headline inflation, which tends to be gold-supportive), and the indirect risk-off channel (a Hormuz event would be a generalised risk-off catalyst that bids gold as a safe haven).
The probability the market is assigning to a closure event is not directly observable, but you can back it out by looking at the differential between current crude and the crude price implied by physical supply-demand alone. Various sell-side desks have published estimates, and the consensus range is somewhere around $15-$25 of premium in Brent at current levels. That premium, multiplied by the rough crude-to-gold beta in a war-premium regime, gives you the embedded gold premium.
The Bank for International Settlements and the IMF have both published on the cross-asset transmission of geopolitical premium, and the BIS work in particular is the cleanest read on how these regimes resolve historically. The pattern is consistent: war premium builds slowly, peaks on event escalation, and decays quickly once de-escalation is credible. The decay is the trade that the 2022 setup taught the bigger desks, and the framework is sitting on the desk for the day the Hormuz situation resolves.
ASIC and FSCA regulation. Cent-account option for small balances. Leverage up to 1:1000 on the offshore entity for the high-leverage archetype.
The Dollar Smile In Practice Today
The dollar smile theory holds that DXY tends to be strongest at the extremes of the global growth distribution: strong when the US is growing fastest (right side of the smile), strong when global risk-off bids the dollar as the world's reserve (left side), and weakest in the middle when global growth is synchronised and capital rotates out of the US.
Today's tape is left-side. Hormuz risk is the global risk-off impulse, and that's what's bidding the dollar even as gold also catches a bid. The two assets, normally inversely correlated, are co-bid because the same impulse drives both. The full framework lives in dollar smile theory, and reading the current tape through that lens is the cleanest way to understand why DXY at 98.466 is not crushing gold the way a textbook would suggest.
By contrast, if we were in the right side of the smile, with strong US growth driving the dollar through rate differentials, gold would be selling off cleanly with the rest of the precious complex. The fact that silver is up 3.45% on a day when DXY is firm is the cleanest confirmation that we're not in that regime. The MACRO MASTERY desk covers the regime classification daily, with the dashboard updated on every print.
The Central-Bank Buying Flow Underneath
One layer beneath the war premium and the real-yields fair value is the structural central-bank buying flow. The World Gold Council has documented elevated central-bank purchases for three straight quarters, with the bulk of the demand coming from emerging-market reserve managers diversifying away from the dollar share of FX reserves.
That flow is price-insensitive within a wide band. It doesn't chase the market, but it also doesn't disappear on a dip. It tends to step in at round-number support and on technical retests. The 4700 round, the 4600 round, the 4500 round are all levels where this flow has historically left footprints in the volume profile. Yesterday's defence of the H4 shelf had the spread behaviour consistent with this kind of flow: tight, persistent, not running stops, not chasing rips.
The slow structural bid is what makes the dip-buy framework work. Without it, gold would be a pure real-yields proxy, and every CPI print would generate a clean directional move. With it, the metal becomes a layered asset where the slow flow sets the floor, the real-yields model sets the fair value, and the war premium sets the overshoot. The XAU/USD hub page has the full structural framework with the historical regime mapping.
What The London Session Said Going Into NY
The London session today held the post-CPI bid cleanly. The European bell saw a brief test toward the 4700 round, the bid stepped in, and the spread tightened back into the European close. That tape behaviour is the same pattern we saw yesterday, and the same pattern we've been seeing for three weeks. The dip-buy is mechanical at this point.
European equities are mixed, DAX firm at 24128.13 (+0.72%), FTSE flat at 10265.11. The European tape is not flagging any new geopolitical impulse, which is itself a tell: when London is quiet, the war premium is in steady-state. When London picks up volume on a Hormuz headline, you'll see it in the spread behaviour and the cross-asset before you see it in the news ticker. That's a desk skill, not an algo skill, and it's one of the reasons we run the London-open dashboard every morning.
Going into the New York open, the question is whether US flow comes in long or short the metal. The COT data from last week showed managed-money net long, but not at extreme levels. There's room for additional length to come in if the war-premium narrative re-escalates. There's also room for de-grossing if a clean de-escalation headline lands. Neither is the base case for today, but both are tail risks worth pricing.
What Would Invalidate This View
INVALIDATION FRAMEWORK
The base case of "bid holds, war premium intact, gold drifts" gets reassessed if any of the following land on the tape:
- A clean break below the 4700 round support on volume, with the H4 shelf failing to defend on retest. That would be the structural signal that the dip-buy flow has stepped back.
- A Hormuz de-escalation headline of substance (not noise), particularly anything that re-opens tanker traffic at pre-escalation rates. The war-premium decay scenario from the 2022 playbook would then activate.
- A hawkish Fed speaker on the tape today repricing the OIS curve materially higher. That would shift the real-yields fair value down enough to test the war-premium buffer.
- A clean break in silver below the 88 round handle while gold also fails the 4700 round. The simultaneous failure of both precious levels would signal the complex bid has lifted.
- A meaningful DXY break above the 99.00 round handle, which would activate the dollar-channel headwind that has been absent in this regime.
ASIC regulated. Strong mid-tier broker with competitive raw-spread accounts and full MT4 and MT5 support.
CPI Print Context From The Official Source
The CPI release is published monthly by the Bureau of Labor Statistics, and the desk's standard practice is to read the print directly from the BLS release rather than the headline summary. The internals (shelter, core services ex-housing, supercore) matter more than the headline for the Fed's reaction function, and the OIS curve's repricing post-print is driven by the internals.
Yesterday's print landed with internals that nudged the curve hawkish but not aggressively so. The headline was digested, the internals were noted, and the market's repricing was concentrated in the 1-2 year part of the curve rather than the long end. That distribution of repricing is the cleanest tell on why gold absorbed: the long-end real-yields impulse, which is what drives bullion fair value, was muted.
Final Takeaway
The gold post-CPI tape held because the war-premium decomposition did not unwind, and until either the geopolitical layer decays or the real-yields impulse runs hot, the dip-buy framework continues.
The cleanest read for the NY session today is that the 4700 round support is the level the institutional flow is defending, the prior-week high is the ceiling the war-premium-intact scenario respects, and the silver tell is the confirming indicator for the precious-complex bid. The Fed cannot un-Hormuz the tape, and the market knows it. The CPI print mattered for the OIS curve, but it didn't matter for the metal's regime. That asymmetry is the trade environment we're in until the geopolitical layer resolves one way or the other.
"Gold doesn't rally on noise. It rallies when the real-yields model and the geopolitical layer point the same way. Right now they do, and the dip-buy is the cleanest expression of it."
IN SHORT
Gold post-CPI tape held the 4700 round and the H4 supply-turned-demand shelf because real yields didn't move enough to dislodge the war-premium bid.
DXY firm with gold firm is the dollar-smile left-side regime, twin safe havens co-bid on Hormuz risk.
Silver up 3.45% confirms structural precious-complex participation, not gold-specific flow.
Educational analysis only. Past performance does not guarantee future results. Manage risk against your own portfolio.
Join MACRO MASTERY
The institutional macro intelligence desk. The exact stack a hedge-fund analyst runs every morning, delivered into a Discord community of serious traders.
07:00 London daily macro pulse. Live trade ideas with entry, target, stop, invalidation. FOMC, NFP, CPI live coverage as the prints land. BTC whale-flow signals. G7 central-bank rate pricing. Weekly performance scorecard, every win AND loss.
Free for life through our Blueberry Markets partnership (ASIC regulated). Members trade through Blueberry, get the entire desk in return. Funds stay with the broker in your name, withdrawable any time. Pure alignment, not a subscription.
Welcome DM lands instantly. Non-US residents only for now, US partner Q3.
Related Reading
- Real yields explained: the framework underneath every gold trade
- How to trade gold XAU/USD 2026: structural framework for the metal
- XAU/USD hub: complete coverage of the gold pair
- Iran war update 2026: full chronology and macro readthrough
- Dollar smile theory: regime classification for the DXY trade
Related from the desk
- Gold Weekly Recap, 5-9 May 2026: XAU/USD Bounces $200 From $4,500 as NFP Beats
- Trump Pauses Project Freedom: Oil Dumps, Gold Rallies, Dollar Cracks
- Central Bank Tightening 2022 Replay: Why Gold Could Fall Again
- Gold Trade Case Study: 5-Lens Read That Captured 3.5R in 9 Hours
- Powell Legacy: Fighting Inflation and Trump at the Fed
FAQ
Why did gold not sell off after the CPI print yesterday?
Gold's fair value is anchored to real yields, but the current price has a war-premium component sitting on top of that fair value because of the Hormuz situation. Yesterday's CPI print moved real yields slightly, but not by a magnitude large enough to dislodge the geopolitical premium. The institutional dip-buy flow at the H4 supply-turned-demand shelf absorbed the post-print volatility, and the metal closed near its session highs. The cleanest way to read it is that the print mattered for the OIS curve, but it didn't matter for the gold regime.
What does the gold post-CPI tape tell us about Fed expectations?
The gold post-CPI tape is signalling that the market read the print as hawkish on the short end of the OIS curve but not aggressively so on the long end. The long-end real-yields impulse, which is what drives bullion fair value, was muted. That suggests the market is pricing modest hawkish drift on the Fed's terminal-rate path without a meaningful change to the medium-term policy stance. Until the Fed delivers a clear repricing signal, gold's regime is dominated by the geopolitical layer rather than the rates layer.
Why is silver outperforming gold on this session?
Silver at 88.07 up 3.45% against gold at 4708.6 up 0.66% represents a compression of the gold-silver ratio. Historically, when silver outperforms gold in the precious-complex bid, it signals broader structural participation rather than a single-asset flow story. The desk reads this as confirmation that the bid is not just macro-hedge community length, but also includes ETF inflow, central-bank diversification, and physical demand. A compressing GSR alongside firm gold is the healthiest version of a bullion regime.
Is the Hormuz war-premium going to fade like 2022?
The 2022 playbook for war-premium fade required two conditions: credible de-escalation and physical supply normalisation. Neither is currently in place. Crude is holding above the 100 round, tanker traffic data has not normalised to pre-escalation rates, and the diplomatic channel has not produced a substantive headline. Until those conditions shift, the war-premium decomposition stays intact. The desk is positioned to recognise the shift when it happens, but the base case today is that the premium is sticky.
What is the most important level for gold today?
The 4700 round support is the most important level for the metal today. It's the natural $100 round, it aligns with the H4 supply-turned-demand shelf, and it was defended on the post-CPI retest yesterday. A clean break below it on volume would be the structural signal that the dip-buy flow has stepped back. Above current price, the prior-week high acts as the ceiling, and a break above on conviction would unlock the next leg of the war-premium-intact scenario.
How does DXY at 98.466 fit with gold rallying?
This is the dollar-smile left-side regime: risk-off bids both the dollar AND gold simultaneously, because the same impulse (Hormuz geopolitical risk) drives capital into both assets as twin safe havens. In a standard disinflation-priced-in regime, DXY firm would be a clean headwind for gold. In a geopolitical risk-off regime, the two assets become co-bid. The fact that we're seeing this divergence is itself the cleanest read on what's pricing the bullion bid right now.
What would invalidate the bullish gold view?
Four things would force a reassessment: a clean break of the 4700 round on volume with the H4 shelf fail
Continue reading