
Is the AI Bubble Bursting? The Nasdaq Is Falling, AI Borrowing Is Surging, and Central Banks Are Getting Worried
I’m not saying artificial intelligence is a scam, and I’m not saying the technology won’t transform the world. Quite the opposite. I’m questioning whether investors have fully appreciated what it costs to build that future, how much of it is being financed with borrowed money, and how long the financial returns could take to arrive.
A genuinely revolutionary technology can still produce a stock-market bubble, and that distinction matters enormously. The internet changed everything and still produced the dot-com crash. So the useful question for a trader isn’t whether AI is real. It’s whether the price being paid for it, and the way it’s being funded, can survive a world where money isn’t cheap.
What the Nasdaq-100 correction actually tells us
A decline of 10% or more from a recent high is commonly called a correction. That’s a meaningful move for an index holding some of the largest and most influential businesses in the world. But context matters: the Nasdaq-100 was still about 11% higher for 2026 at Monday’s close, and this is its third correction of the year after the falls that crossed the threshold on 27 March and 29 July.
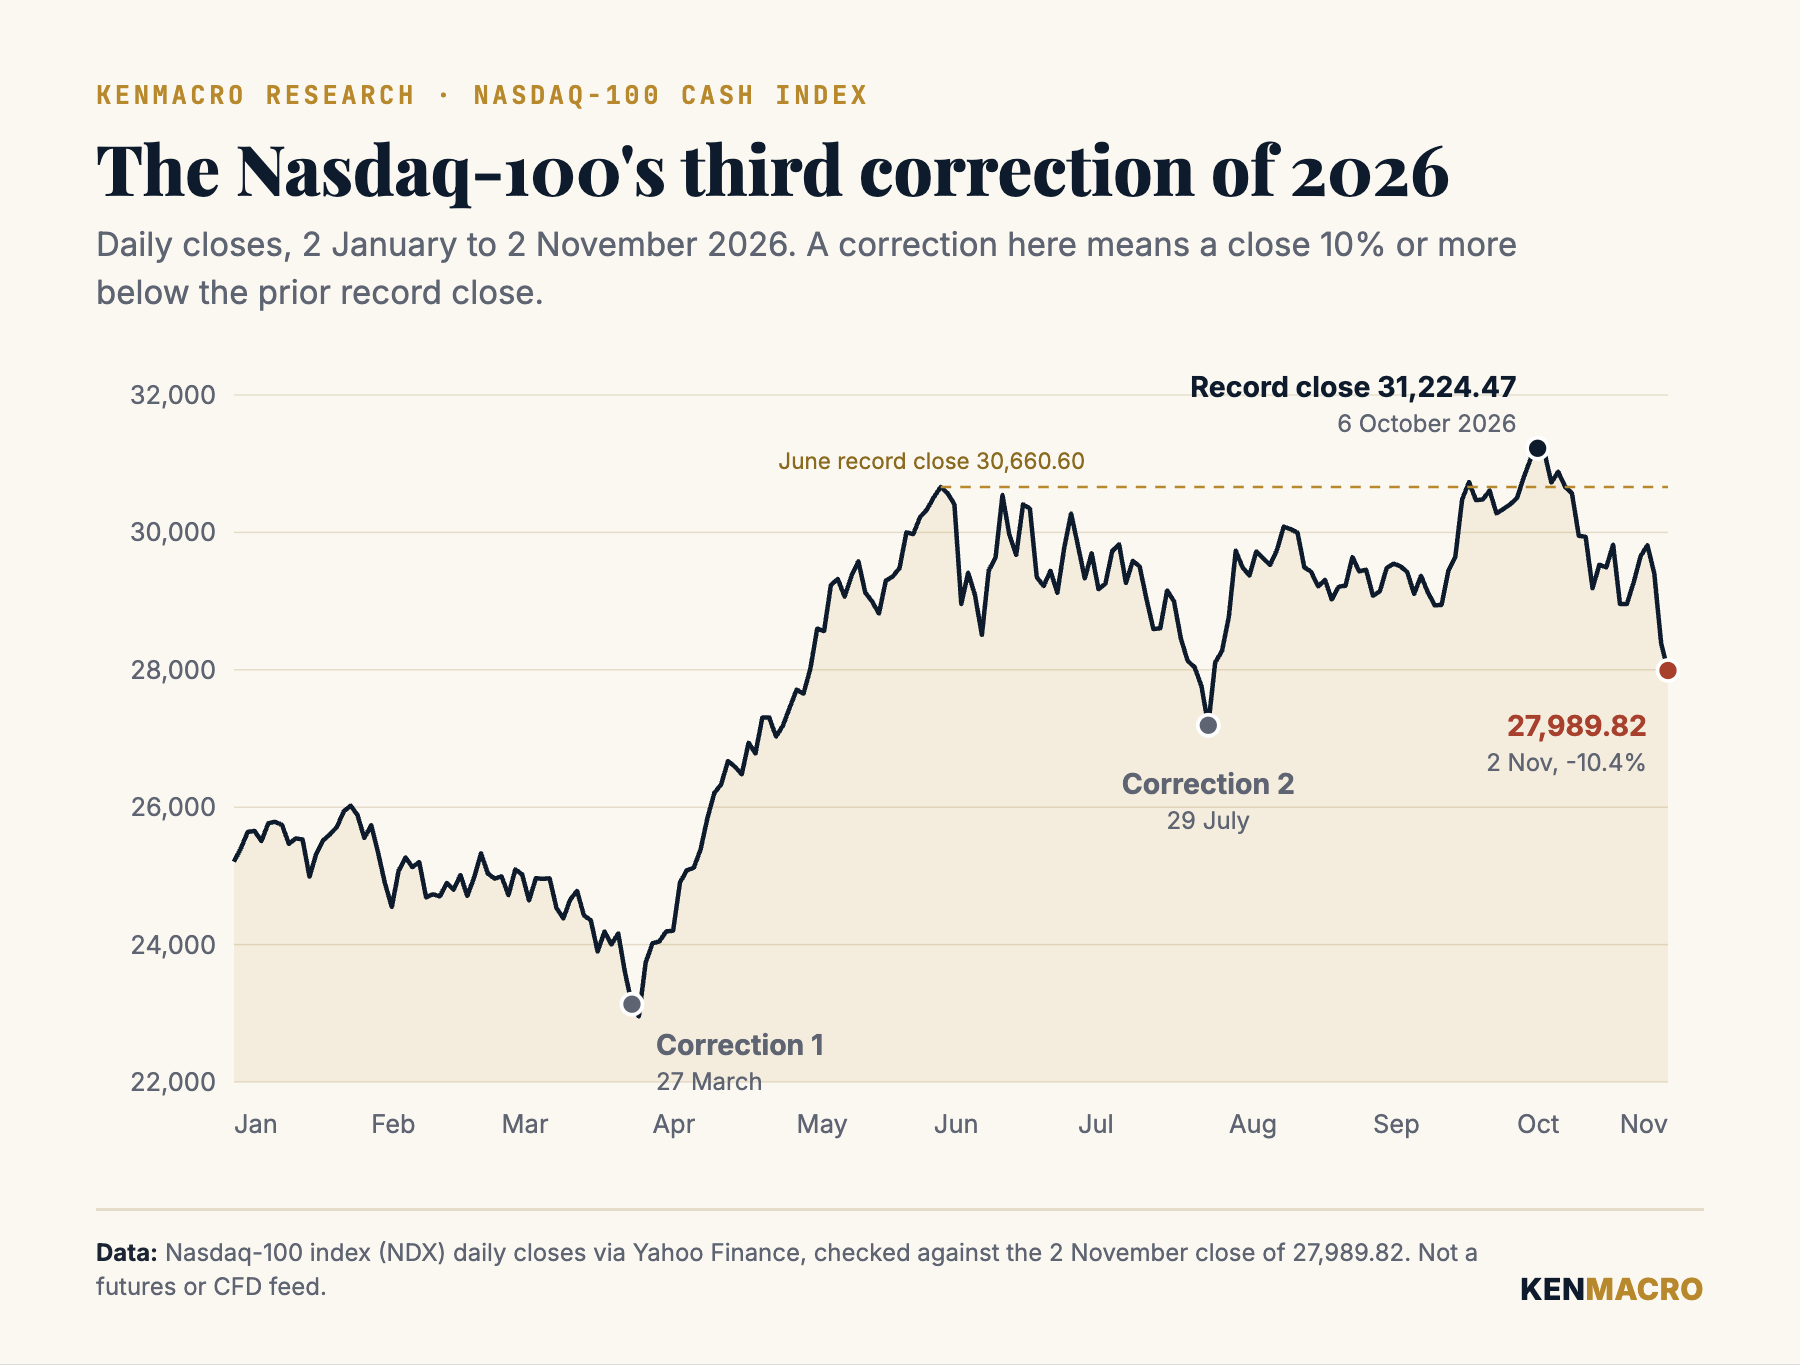
| Measure | Value |
|---|---|
| Record close, 6 October 2026 | 31,224.47 |
| Close, 2 November 2026 | 27,989.82 |
| Decline from record close | -10.4% |
| Change in 2026 to 2 November | +10.9% |
| Earlier 2026 corrections began | 27 March, 29 July |
So we need to separate a potentially serious change in sentiment from a declaration that the whole technology boom has ended. My concern is less about how far the Nasdaq has fallen so far and more about what investors are beginning to question. For years the AI story has been about growth: more computing power, more data centres, greater productivity and higher future earnings.
Now the questions are different. How much is all this going to cost, who’s providing the financing, at what interest rate, and when does the investment start generating enough cash to justify the spending? Those are much more uncomfortable questions, and they’re exactly where the bond market comes in.
The $218 billion AI borrowing boom
Let’s put real numbers behind this. According to research published by LSEG and FTSE Russell on 29 October 2026, investment-grade bond issuance by five hyperscalers, Amazon, Alphabet, Meta, Microsoft and Oracle, had reached about $218.1 billion by early October 2026. That compares with $107.3 billion for the whole of 2025, so the amount issued had already more than doubled the previous year’s total with three months still to run.
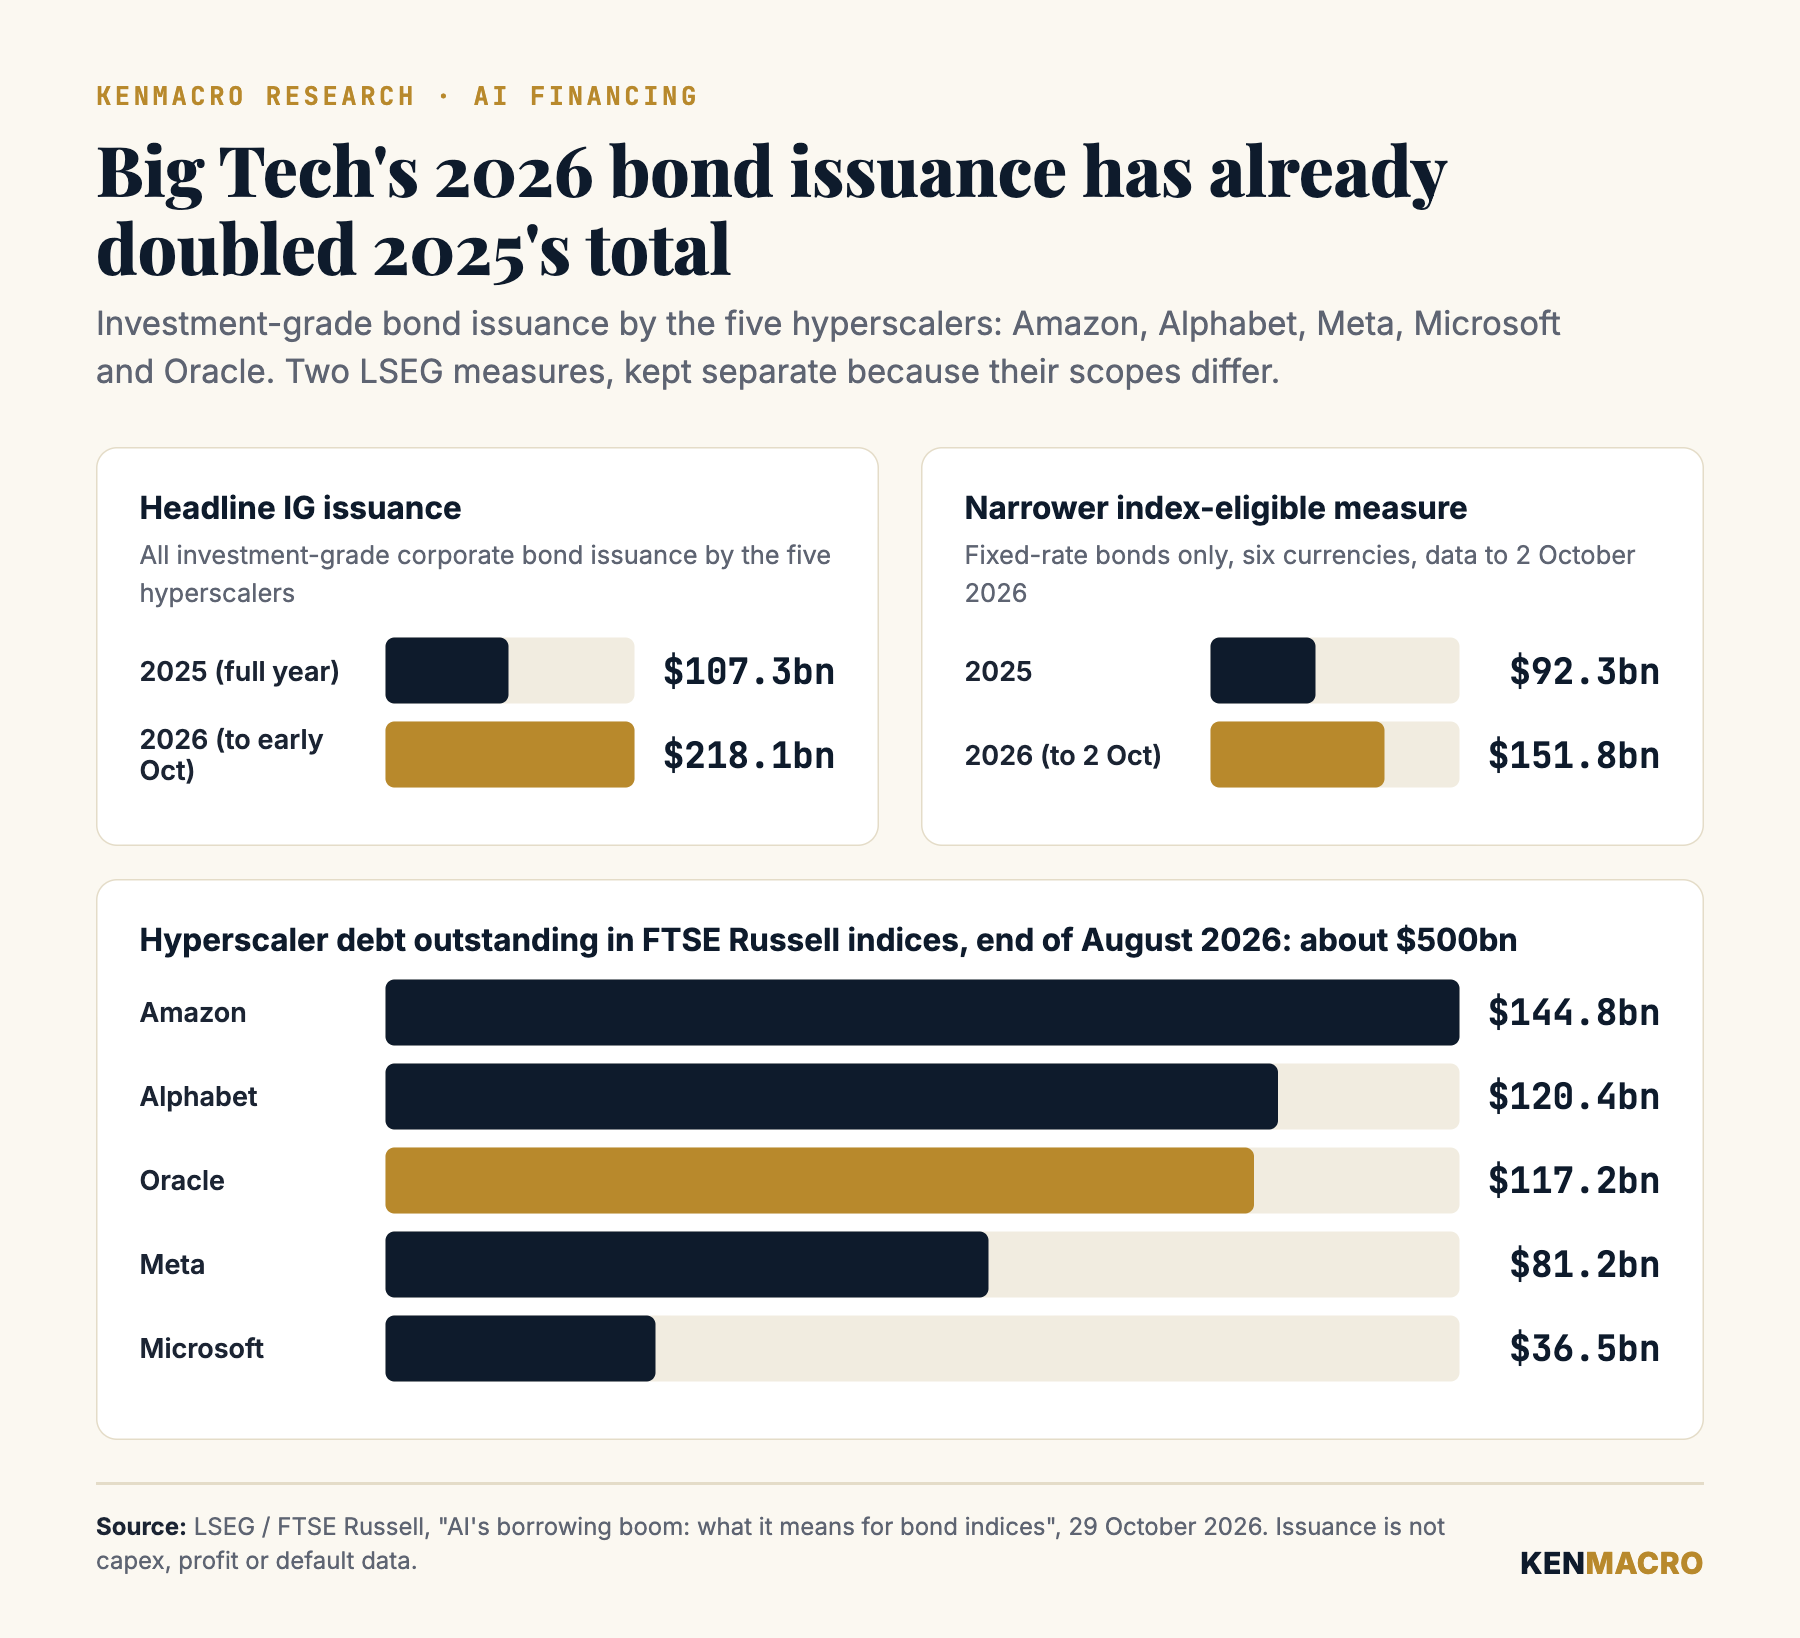
| Measure | 2025 | 2026 |
|---|---|---|
| Investment-grade issuance, five hyperscalers | $107.3bn (full year) | $218.1bn (to early October) |
| Index-eligible fixed-rate bonds, six currencies | $92.3bn | $151.8bn (to 2 October) |
These aren’t struggling start-ups. They are some of the largest companies on the planet, and LSEG puts their debt outstanding across its indices at about $500 billion at the end of August, led by Amazon at $144.8 billion. I want to be precise about what the $218 billion is: it’s issuance, not losses, not defaults and not the total stock of debt, and not every dollar of it is financing AI.
Many of these businesses have enormous operating cash flows, substantial assets and easy access to capital markets, so issuing bonds doesn’t mean they’re in distress. But the figures tell us something important. The AI build-out has become so large that external financing now plays a significant role, and once you fund a programme of this size with debt, the cost of capital starts to matter.
LSEG also cites JPMorgan’s estimate that global AI-related capital expenditure could reach $5.5 trillion through 2030. Capital expenditure is money spent now on assets expected to pay off later: data centres, servers, chips, power connections, cooling systems and buildings that can take years to complete and earn a return. Investors are effectively being asked to believe that the eventual profits will justify those costs, and the higher the cost of financing, the harder that maths becomes.
The bond market has already noticed. LSEG shows hyperscaler bonds trading at a spread of about 119 basis points over Treasuries in October, against 86 for the broad FTSE US investment-grade index, with Oracle, the lowest-rated of the five at BBB-, at 210. Lenders are asking for a premium to fund this build-out, and that’s information.
Why higher interest rates change the economics of AI
Let’s simplify it. Imagine a company wants to spend $10 billion building AI infrastructure and borrows to finance it. At a hypothetical 3% borrowing cost that debt costs $300 million a year in interest, and at 6% it costs $600 million, an extra $300 million every single year that has to come from more revenue, less spending elsewhere or a smaller return.
| Borrowing cost | Annual interest |
|---|---|
| 3% | $300m |
| 6% | $600m |
Real corporate financing is more complicated than that. Maturities vary, some debt is fixed-rate and some floating, companies refinance over time, and the biggest technology businesses fund much of their investment from operating cash flow. But the underlying relationship holds: the more capital a business needs, and the more expensive that capital becomes, the greater the pressure to generate a sufficient return.
Now apply that across an investment boom measured in trillions of dollars and you can see why the bond market matters. The next question isn’t simply how much demand there is for AI. It’s whether that demand produces enough return to justify the infrastructure being built, and that’s where I think the stock market is becoming more selective.
Australia’s central bank has just warned about this
On Tuesday, 3 November 2026, the Reserve Bank of Australia raised its cash rate by 25 basis points to 4.85%, the highest Australian cash rate since 2008. Six members of the Monetary Policy Board voted for the increase and three preferred to hold at 4.60%. The bank now expects headline and trimmed mean inflation to stay above 3% until the end of 2027.
The more interesting part is what its November Statement on Monetary Policy says about artificial intelligence. The RBA judges that upside risks to inflation from the Middle East conflict and AI-related investment remain, and warns that strong AI-related investment activity could push up input costs by more than expected. It also points to rapid growth in AI-related prices and very strong data centre investment.
The risk is still worth attention, because AI is no longer just a story about software and share prices. It’s becoming a story about the physical resources needed to build it: electricity, industrial equipment, semiconductors, skilled workers, construction capacity and finance. When demand for those grows faster than supply can respond, prices rise.
That creates an awkward problem. The same investment that supports growth can also create inflation pressure that makes central banks less comfortable cutting rates. That matters far beyond Australia, for the Federal Reserve, for US Treasury yields and for the Nasdaq.
The AI boom could be creating its own headwind
This is the relationship I want traders to understand. An AI investment boom supports company revenues and economic growth, but it also increases demand for physical resources, which can lift input prices. Persistent inflation can make central banks reluctant to ease, higher financing costs make long-dated projects less attractive, and higher real Treasury yields reduce the present value investors put on future earnings.
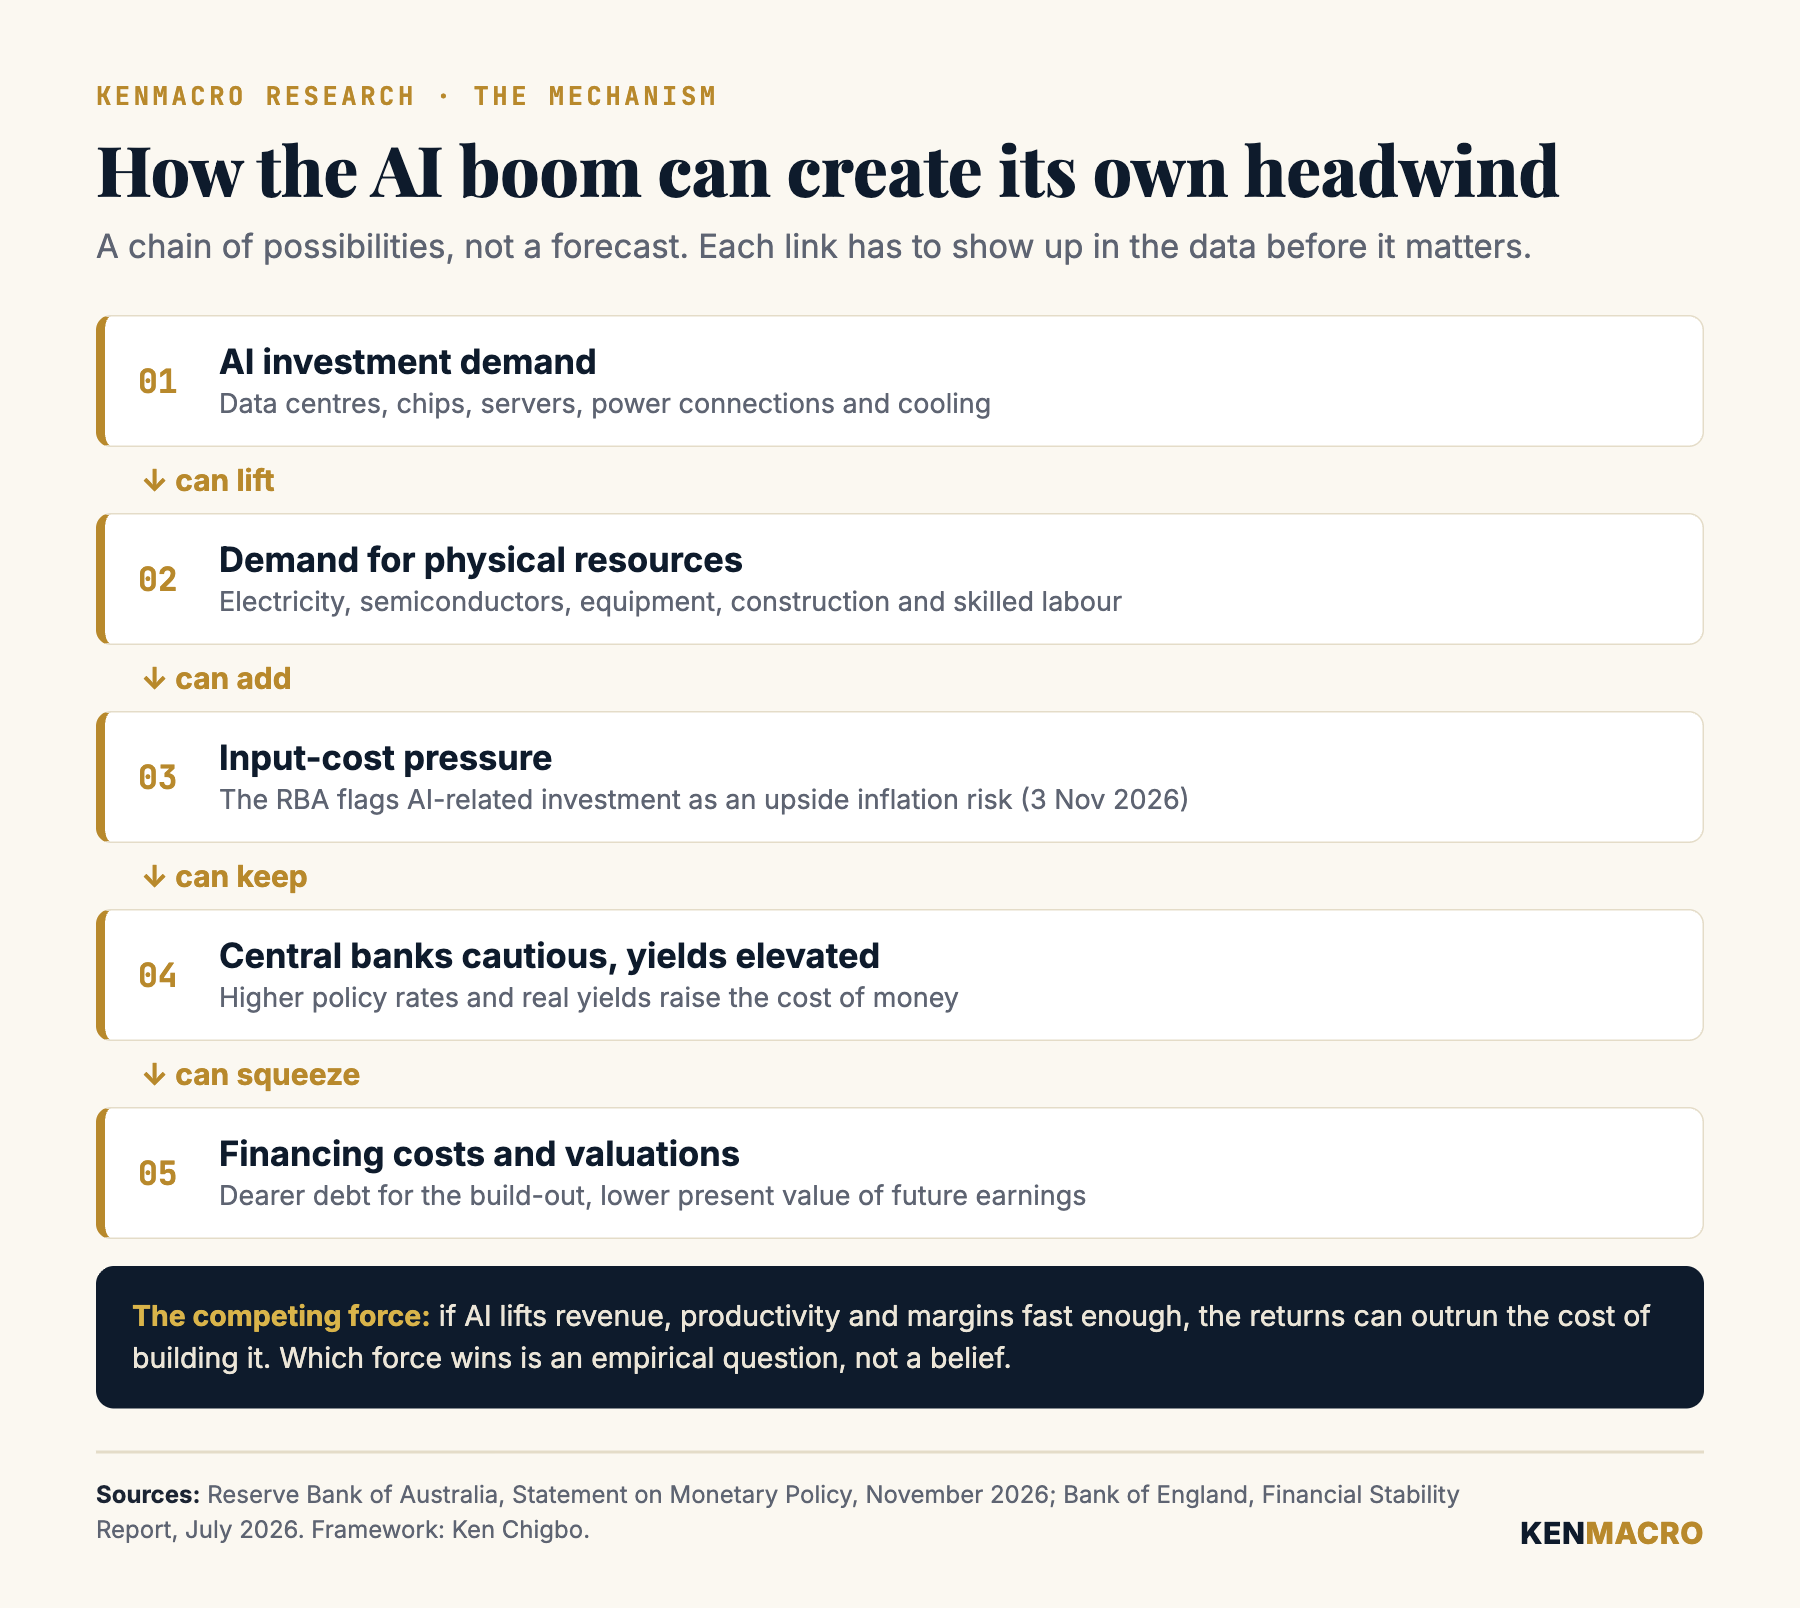
So you end up with two competing forces: the positive effect of AI on future profits, and the negative effect of what it costs to build. Which one dominates depends on actual numbers, namely productivity, revenue growth, margins, capital expenditure, financing costs and cash generation. It’s a mistake to assume higher AI spending must mean higher AI stock prices, because spending money isn’t the same thing as making money.
Why the bond market matters more than the latest AI headline
Plenty of retail traders spend hours on technology-stock charts and almost none on the US Treasury market. But Treasury yields set the broader cost of money across the financial system. They also set the return investors can earn without taking equity risk, so when yields are high, companies priced on enormous future earnings have more to justify.
| Measure | 2 Nov 2026 |
|---|---|
| US 10-year nominal Treasury yield | 4.91% |
| US 10-year real (inflation-adjusted) yield | 2.62% |
| 10-year real yield, 5 October peak | 2.95% |
Here’s a simple illustration. Imagine an investment that pays $10 billion in cash ten years from now. Discounted at 4% a year, that future cash is worth about $6.76 billion today; at 8% it’s worth about $4.63 billion.
The cash flow hasn’t changed and neither has the time until it arrives, but the value investors put on it has dropped by almost a third. That’s why rising discount rates hurt highly valued growth companies. Treasury yields don’t set equity valuations on their own, because company risk, growth, margins and alternatives all count, but a big change in the required return makes an enormous difference to the price investors will pay. I went through the wider version of this in why bond yields are rising and what it means for stocks, gold and the dollar.
Tech is falling while yields fall, and that’s the worrying part
Here’s the detail most people are missing. The 10-year real Treasury yield peaked at 2.95% on 5 October, the day before the Nasdaq-100’s record, and had fallen to 2.62% by 2 November. Technology shares sold off by more than 10% while real yields dropped by 33 basis points, so this decline is not simply a rising-rates story.
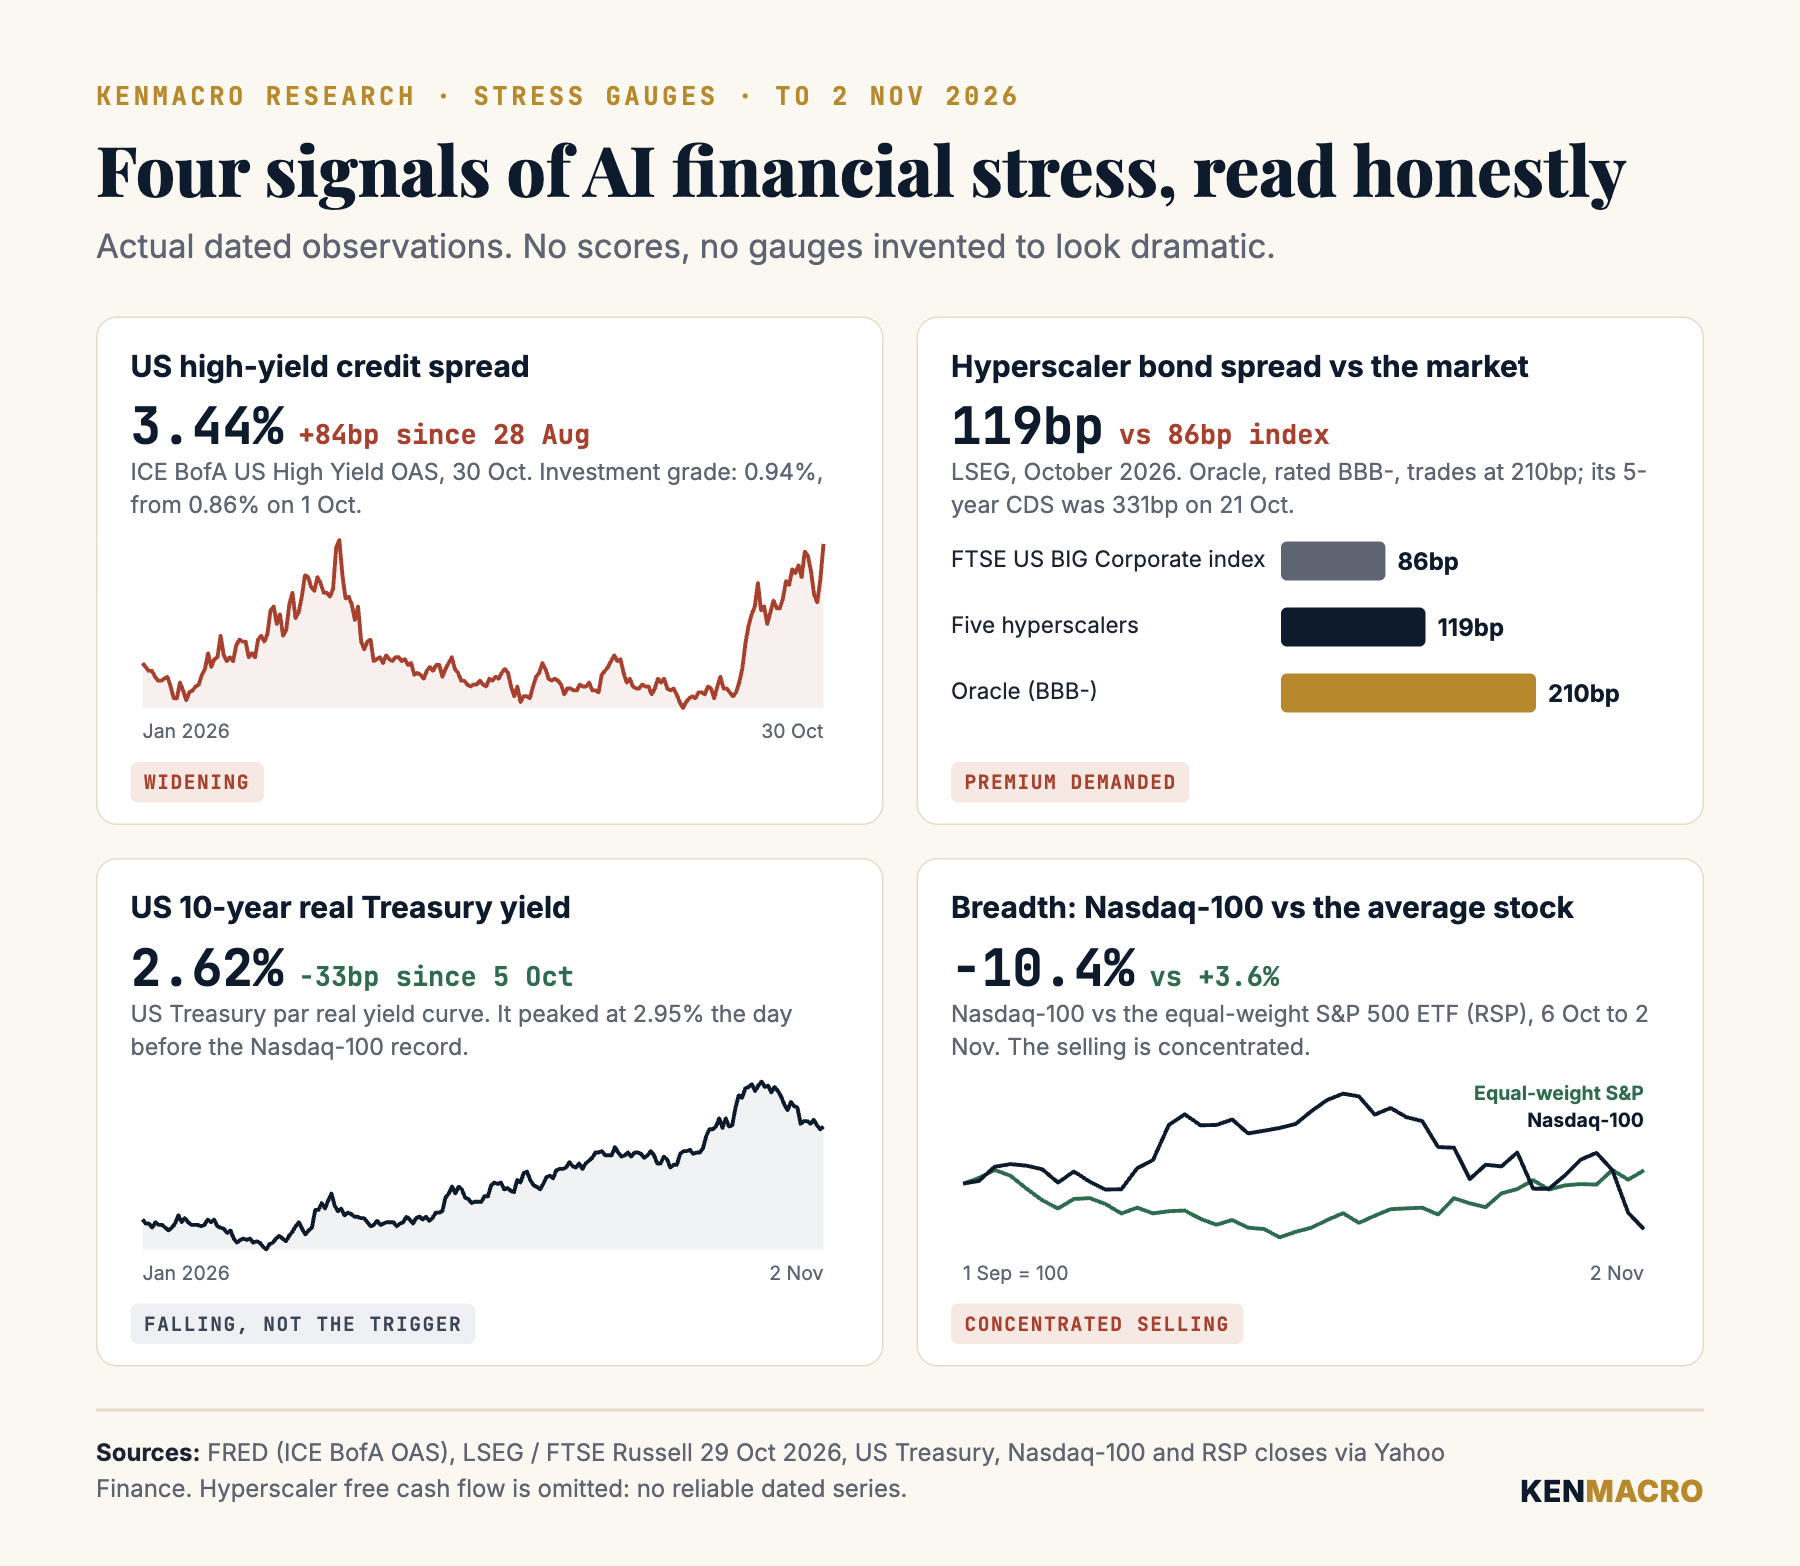
When yields fall and technology still struggles, I want to know why investors are buying bonds. If they expect a more supportive rate environment, that can eventually help technology valuations. If they’re growing more worried about future economic and corporate performance, it reflects weakening confidence in the earnings outlook, and those are very different reasons.
Monday’s session showed the selling was concentrated. The Nasdaq Composite fell 1.1% and the S&P 500 slipped 0.5%, but the Philadelphia Semiconductor index dropped 3.4% while the equal-weight S&P 500 ETF actually rose 0.8%. Since the 6 October Nasdaq-100 record, that equal-weight fund is up 3.6%.
That’s useful information. Investors aren’t abandoning every risky asset; they’re reassessing the specific parts of the market where expectations were most demanding. Credit is moving too: the US high-yield spread has widened from 2.60% on 28 August to 3.44% on 30 October. For me, all of that points at the AI investment and valuation debate as the issue to investigate.
The Bank of England has already raised the alarm
This isn’t just analysts on social media. In its July 2026 Financial Stability Report, the Bank of England said AI-related companies’ use of credit markets has accelerated rapidly, across public bonds, private credit and leveraged and structured finance, and called the pace of investment unprecedented historically. It said AI-related valuations have become more stretched on some metrics and rest on earnings forecasts that are highly uncertain.
It also warned that a reassessment of those prospects could trigger a fall in equity prices amplified by high market concentration, correlated momentum-driven positions and increased leverage. It added that the growing complexity and opacity of some debt structures could increase financial stability risks. Those risks aren’t identical across companies: a cash-rich giant with manageable borrowing is very different from a leveraged infrastructure project that depends on refinancing, and both differ again from a smaller AI business still proving its revenue model.
The Bank was also clear that AI has the potential to raise productivity across many sectors. It did not declare that a bubble had burst, and it found little evidence so far that AI borrowing is crowding out other borrowers. The issue isn’t whether the technology has value; it’s how much investors are paying for it, how it’s financed, and how long it takes to earn a return.
Are we repeating the dot-com bubble?
The comparison is worth discussing as long as we’re clear about what it does and doesn’t tell us. The internet genuinely transformed the global economy, changing how companies communicated, sold products and built entire industries. That didn’t mean every internet company in the late 1990s was worth the valuation investors paid, or that every business model would succeed.
Some companies were profitable and resilient, while others depended on outside finance, optimistic growth assumptions and the ability to keep attracting investors. When expectations changed, the market punished many of them: some went bust, others survived and became enormously successful, and the technology kept developing while the stock-market bubble collapsed. AI could follow a completely different financial path.
Today’s leaders aren’t speculative start-ups; many have established products, recurring revenue and huge cash generation. But that doesn’t remove the risk of paying too much for future growth, or guarantee that every dollar of AI infrastructure earns an attractive return. My concern is that the market got too comfortable treating rising AI spending as evidence of rising future profits, and those aren’t the same thing.
What would actually confirm the AI bubble is bursting?
For me, a 10% Nasdaq correction isn’t sufficient proof on its own. I’d want to see more evidence lining up, and these are the five things I’m tracking.
- AI spending fails to generate the expected revenue. If companies keep expanding infrastructure while revenue growth disappoints, the economics become less convincing and margins and cash flow come under more scrutiny.
- Financing gets more expensive. If credit spreads widen materially, lenders are demanding more to take corporate risk. A company can see Treasury yields fall and still pay more to borrow if its own credit premium rises, which is why the hyperscaler spread matters.
- Companies cut or delay investment. A significant reduction in planned AI spending would hurt the suppliers whose share prices depend on continued build-out. It could also improve cash flow at some hyperscalers, so the effects would differ across the market.
- Good earnings keep getting sold. If companies deliver respectable results and their shares still fall, investors had priced in even more. If estimates fall while valuations stay demanding, the pressure can continue.
- The technical structure deteriorates. Lower highs and lower lows on the daily chart matter, but I’d want earnings revisions, credit conditions and broader market weakness to back them up before calling it a prolonged bear market.
A stock-market bubble isn’t proved or disproved by a single indicator. It takes several of these moving together, and right now we have the price move and some widening in credit, but not the full set.
And what would prove the bears wrong?
This matters just as much, because I don’t want to get so attached to a bearish argument that I stop recognising new information. The AI investment case strengthens if companies show the infrastructure is producing attractive returns: faster revenue growth, better cash generation, higher utilisation of computing capacity, better margins and strong demand for AI services. A financing environment that stays supportive without a real deterioration in credit quality would help too.
Technology improvements could also cut computing and operating costs over time, which would ease some of the inflation pressure from the build-out. If productivity gains arrive faster than expected, the economic benefits could be very large. And if Treasury yields fall because inflation is easing while profits stay strong, that’s a much more supportive backdrop for technology shares. The bearish case needs evidence, and so does the bullish one.
The three Nasdaq scenarios I’m watching
| Scenario | What confirms it | What it could mean |
|---|---|---|
| Inflation and financing pressure | AI input costs stay high, real yields recover, corporate borrowing stays expensive | More pressure on long-duration technology valuations |
| AI investment disappointment | Cash flow weakens while spending keeps rising, earnings estimates fall, credit spreads widen | Higher risk of a deeper technology-led correction |
| Orderly recovery | AI revenue and profits justify the investment, financing stabilises, technical structure improves | The correction gives way to a more sustainable advance |
I want to see which scenario the market actually supports, and to recognise early when the evidence starts contradicting my preferred view. That’s the discipline that keeps a macro thesis from turning into a hope.
How I’m approaching the Nasdaq chart
Understanding the macro doesn’t mean I immediately short the Nasdaq, because that’s not how I trade. The macro tells me which risks matter, and the chart decides whether there’s a technically sensible opportunity. On the Nasdaq-100 I’m watching the daily and four-hour structure: are rallies forming lower highs, are broken support zones becoming resistance, and does price fail when it returns to an important supply area?
I also want those moves to line up with what yields, credit and technology earnings are doing. For shorter-term trades I look for confirmation on the lower timeframes rather than assuming the macro thesis plays out straight away, as in the Nasdaq structure I walked through on 30 October. On the daily chart, the June record close of 30,660.60 was reclaimed in September and lost again in October, which makes it the first level I’d want back before taking a recovery seriously.
I always define what would invalidate the idea. A sustained recovery through important structure, improving earnings confidence and broader participation would weaken a bearish continuation case, and a renewed breakdown alongside disappointing earnings and tighter financing would strengthen it. The point isn’t to predict every candle; it’s to understand the environment and let the market confirm or reject the analysis.
My view: the technology can change the world while the stocks disappoint
Artificial intelligence could become one of the most economically important technologies of our lifetime. Investors can still lose money buying a remarkable technology at a remarkable valuation, because the difference between a great technology and a great investment is the price you pay and the return the business actually delivers.
Right now we’re watching an enormous investment boom. Big Tech’s bond issuance has already doubled last year’s total, a central bank has named AI investment as an inflation risk, the Bank of England has flagged financing structures and leverage, lenders want a premium to fund the hyperscalers, and the Nasdaq-100 is in correction. None of those facts on its own proves a bubble is collapsing.
Together, they raise a much better question than whether the next AI product launch will impress investors: what happens when the cost of building the AI revolution starts running into the profits investors were promised? That’s the relationship I’m watching. The borrowing, the bond market, the inflation consequences, the actual earnings, and then what the technical structure tells me, because when the macro picture and the chart tell the same story, that’s when I get interested.
- The complete macro and technical education library, including the Macro Trading Blueprint.
- Live New York market sessions, Monday to Friday at 14:00 UK, covering the Nasdaq, gold, currencies and the economic backdrop.
- Session recordings and classroom resources, so you can revisit every lesson.
- The trading community, where we discuss economic developments, chart structure and trade ideas.
- The KenMacro Structure Desk indicator, planned for members once access arrangements are complete.
Frequently asked questions
Is the AI bubble bursting in 2026?
Not proven. The Nasdaq-100 entered correction territory on 2 November 2026, closing at 27,989.82, about 10.4% below its 6 October record. Investors are questioning AI spending, debt financing and valuations, but a correction is evidence of changing sentiment, not proof that a bubble has collapsed.
Why is the Nasdaq falling?
The recent weakness has been concentrated in large technology and semiconductor stocks as investors reassess the return on enormous AI capital spending, high valuations and financing needs. On 2 November the Philadelphia Semiconductor index fell 3.4% while the equal-weight S&P 500 ETF rose 0.8%, so the selling has not hit every sector equally.
How much are big technology companies borrowing for AI?
LSEG reports that investment-grade bond issuance by Amazon, Alphabet, Meta, Microsoft and Oracle reached about $218.1 billion by early October 2026, compared with $107.3 billion in all of 2025. That measures issuance, not the total stock of debt, and not every dollar is spent directly on AI.
How do higher interest rates hurt AI stocks?
Higher rates raise the cost of financing infrastructure and the return investors demand from equities. They also reduce the present value of earnings expected far in the future: $10 billion received in ten years is worth about $6.76 billion today at a 4% discount rate, but only about $4.63 billion at 8%.
Can AI itself cause inflation?
Strong AI investment raises demand for semiconductors, electricity, equipment and construction, which can push up input costs. The Reserve Bank of Australia judged AI-related investment an upside inflation risk in November 2026, while noting that AI-related price pressures have not broadened materially beyond electronics.
Did the Bank of England warn about an AI bubble?
Its July 2026 Financial Stability Report warned that AI-related valuations look stretched on some metrics, that AI borrowing has accelerated rapidly, and that concentration, momentum and leverage could amplify a fall if earnings expectations are reassessed. It did not declare that a bubble had burst, and it highlighted AI’s potential to raise productivity.
Can the Nasdaq fall even when Treasury yields decline?
Yes. Between 6 October and 2 November 2026 the Nasdaq-100 fell 10.4% while the 10-year real Treasury yield fell from 2.95% to 2.62%. Falling yields can reflect expectations of easier policy, but they can also come with weaker earnings expectations or reduced appetite for expensive equities, so the reason for the move matters.
What would support a recovery in the Nasdaq?
Stronger AI revenue and cash generation, more sustainable capital spending, stable corporate credit conditions, supportive moves in Treasury yields and improving technical structure, such as a sustained recovery above the June record close of 30,660.60, would all strengthen the recovery case.
Research log. 3 November 2026: first published. All index figures recalculated from daily closes; the LSEG headline issuance figure and its narrower index-eligible measure are reported separately because their scopes differ; RBA and Bank of England statements quoted from the primary documents.
Get the macro framework the desk actually trades
The same regime-first framework behind every call on this site. Free. No spam, unsubscribe anytime.
Trading USD pairs?
Platform, spreads and execution decide more than the call does. Check your broker route before opening an account.
Continue reading
From the desk
Where this gets traded
CPI and FOMC are the moments a weak broker is exposed, spreads gap and fills slip. See the KenMacro desk guide to the best brokers for trading the print.
Read the desk guide →