
Oil Surged. Gold Fell. Here’s Why the Macro Picture Mattered This Week
Oil was pushing higher. Gold was losing ground. Technology shares were under pressure, and for stretches of the week US Treasury yields were falling too. If your analysis starts and ends with a pattern on the chart, that is an awkward combination to explain, because most of the textbook relationships traders memorise were pointing the other way.
I have been banging on about this for years. A chart tells you what price has done, but the forces that change what traders are willing to pay for an asset often sit outside it: interest rates, bond yields, energy supply, central bank expectations, positioning and risk appetite. That is why I work from the macro picture into the technicals, not the other way round, and this week was a very good example of why.
Below I have used five real TradingView screenshots of my KenMacro Structure Indicator, on US oil, gold, silver, the Nasdaq and GBP/JPY, to show how the two sides fit together. They are not mock-ups and they have not been edited.
The week in numbers
| Market | Latest reported figure | Why it matters |
|---|---|---|
| Brent crude | $116.72 settle on 23 Oct, up 3.14% | Highest close since 29 April, on supply fears after attacks in Saudi Arabia |
| WTI crude | $103.27 settle on 23 Oct, up 3.8% | US crude back above $100 adds to the inflation risk |
| Gold | Below $4,000 on 23 Oct, down about 4% on the week | Its worst week since June, despite lower yields on Thursday |
| US 10-year Treasury yield | 4.96% on 22 Oct, down 17 basis points | Bonds were bought during the technology sell-off |
| US stocks | S&P 500 down 0.52%, Nasdaq down 0.21% on 23 Oct | The Nasdaq’s second straight weekly loss |
| Federal Reserve | 3.75% to 4.00%; next decision 27 to 28 October | The next big test for oil, yields, gold and the dollar |
Oil: the market is putting a price on supply risk
The Middle East was back at the centre of oil trading this week. After a series of Houthi attacks in Saudi Arabia and an oil spill reported by authorities in the United Arab Emirates, Reuters reported Brent settling at $116.72 a barrel on Friday 23 October, up 3.14% on the session and its highest close since 29 April. West Texas Intermediate settled at $103.27, up 3.8%.
This is more than an oil story. A persistent energy shock pushes against household spending, business margins and the inflation outlook, and it can leave central banks dealing with higher prices and weaker growth at the same time. The Federal Reserve can influence demand through interest rates, but it cannot produce barrels of oil or keep shipping routes open.
This is where the technical work becomes useful. A macro reason to pay attention to oil is not automatically a buy signal. We still need structure, liquidity, a level that tells us the idea is wrong and a sensible amount of risk.
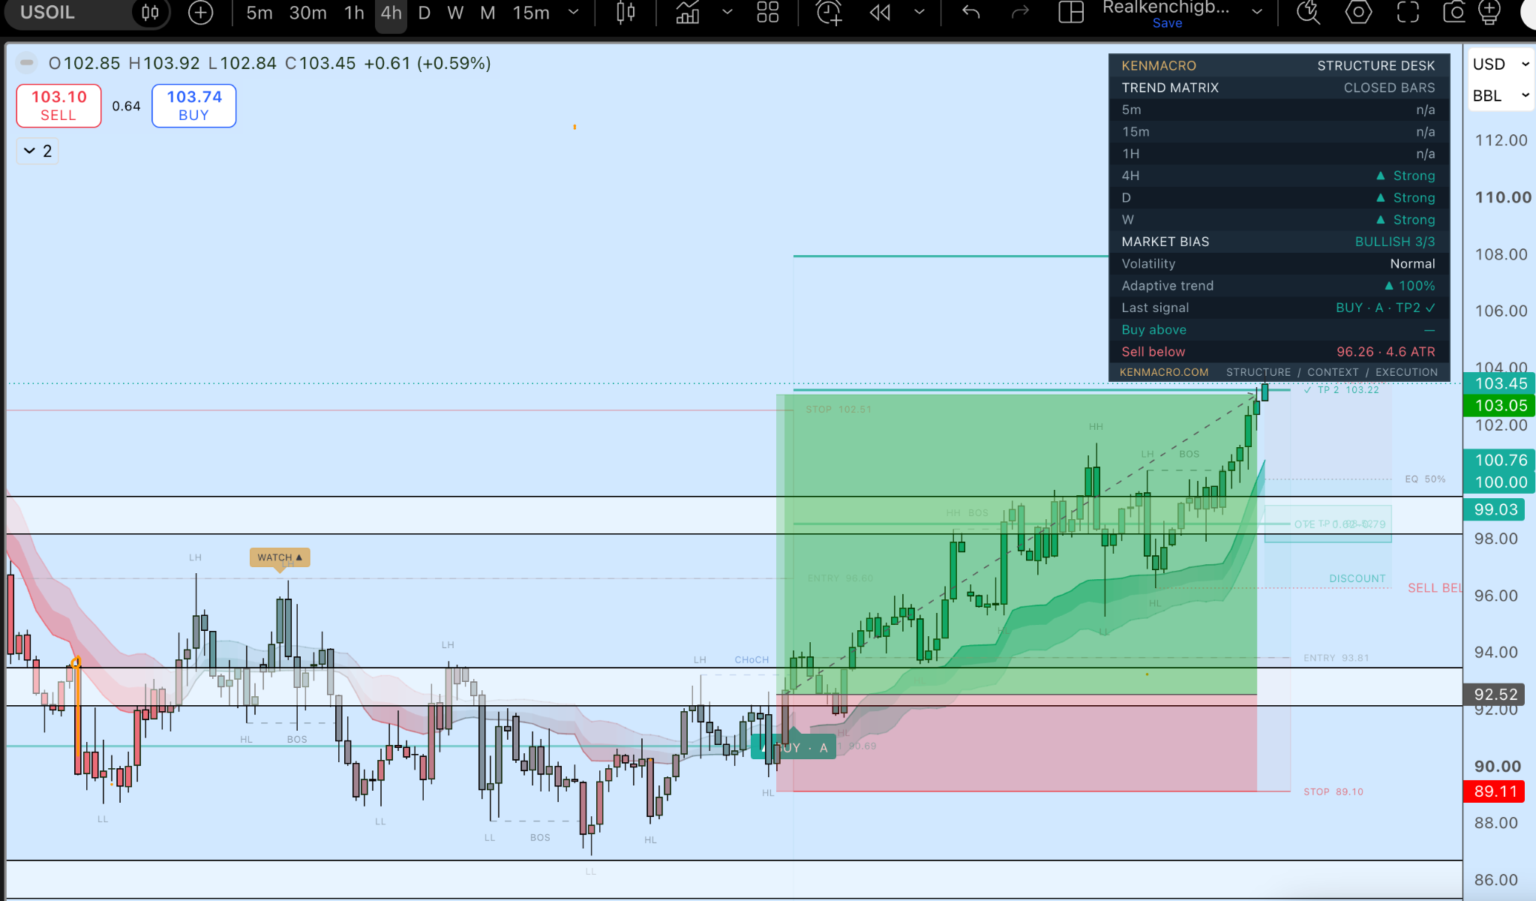
Look at the panel in the top right. The trend matrix reads the 4-hour, daily and weekly as strongly bullish, and the market bias is 3/3. The chart shows the structure behind that: a change of character, then higher highs and higher lows, with the plan’s entry, stop and targets laid out before price moved. The macro reason and the structure were pointing the same way, and that is the combination I want before I take oil seriously from the long side.
Gold: falling yields did not mean an automatic rally
Gold was the other side of the story. Spot gold slipped below $4,000 an ounce on Friday and was heading for a weekly fall of around 4%, its steepest since June. It came under pressure even on Thursday, when money moved into US Treasuries and the 10-year yield fell 17 basis points to 4.96%, with real yields lower as well.
That matters. Traders often memorise correlations, such as lower yields being good for gold or risk aversion being good for gold, and then get caught when the market is trading something more complicated. This time higher oil was feeding inflation worries and expectations of tighter policy, while the sell-off in technology shares added to the pressure, and some investors appear to have been selling liquid positions to raise cash rather than buying every asset described as a haven.
None of that means those relationships have stopped existing. It means the reason yields move matters as much as the direction. The gold and silver charts below show the bearish structure the indicator was tracking, and the useful question is whether the macro environment supports that picture, not whether a red or green signal appears on its own.
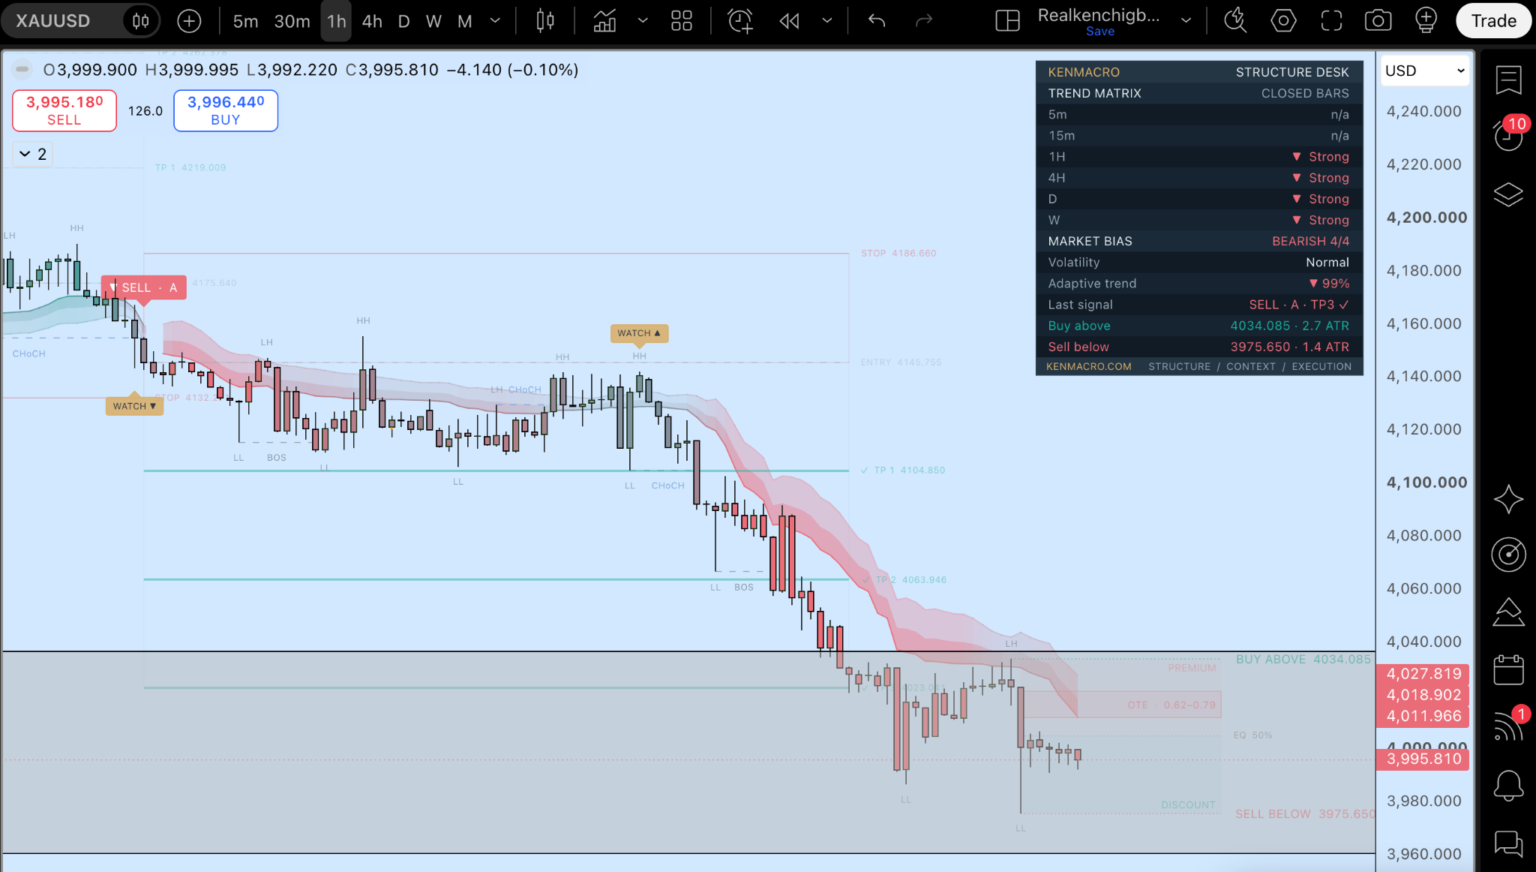
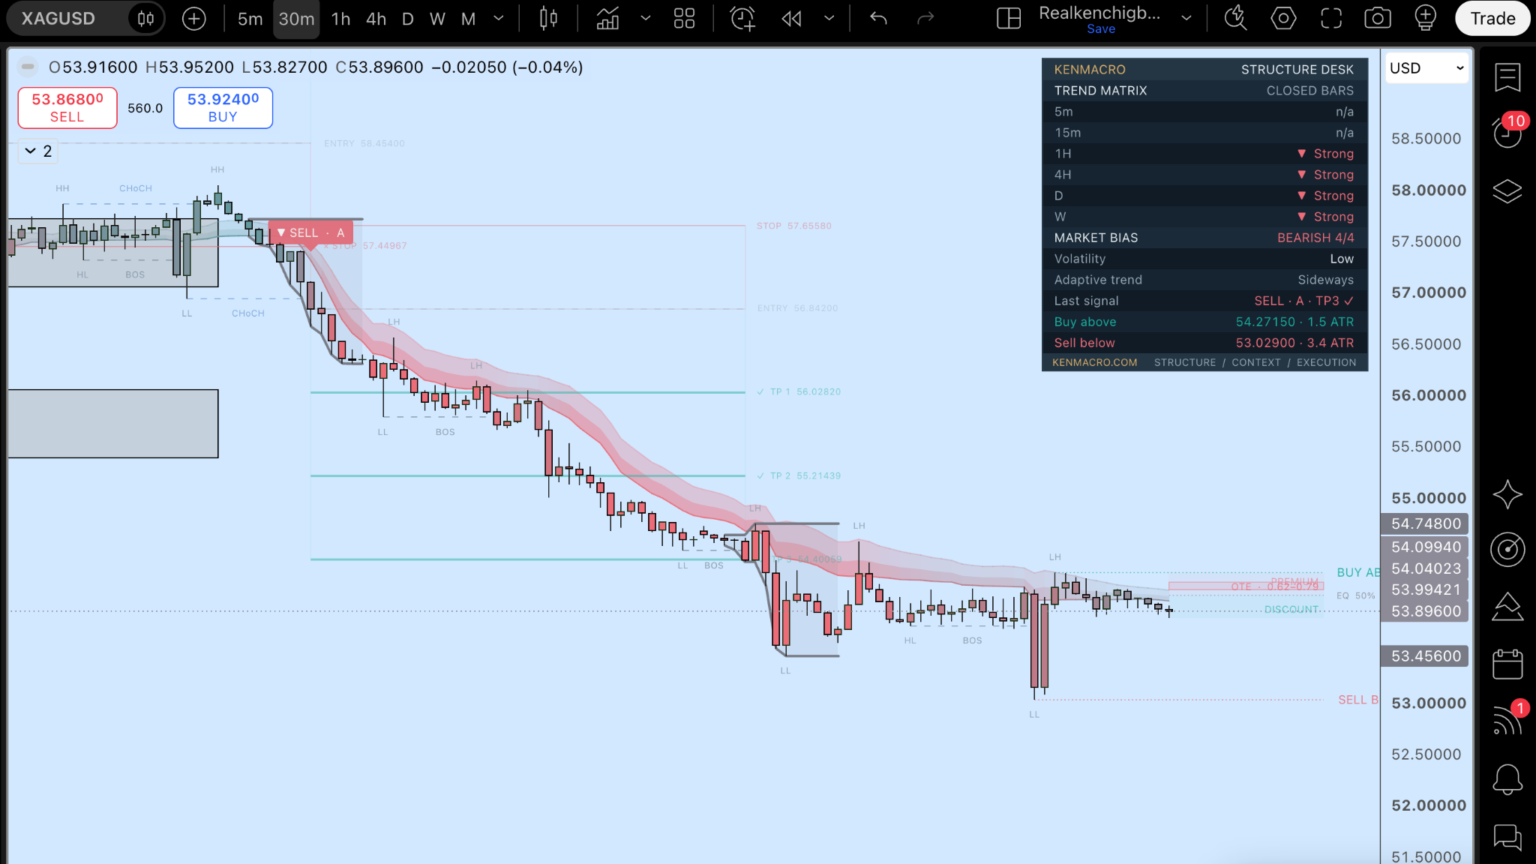
On both metals the indicator reads the 1-hour, 4-hour, daily and weekly as strongly bearish. That is the structure agreeing with the macro, and that agreement is what gives a short idea some weight. If gold starts to hold above the panel’s “buy above” level while real yields keep falling, that would be the first sign the regime is changing back, and I would want to see it on the chart before believing it.
Nasdaq: the cost of capital still matters
The technology sector has been facing a less comfortable question: how much of today’s investment spending will produce tomorrow’s return? The Nasdaq Composite slipped 0.21% on Friday and the S&P 500 lost 0.52%, giving the Nasdaq its second weekly loss in a row. Treasury yields fell during part of the week’s technology-led sell-off, but that was not enough to produce a clean rebound.
When the market is nervous about financing costs, valuations and future cash flows, you cannot assume lower bond yields mean everyone wants to buy technology. We have to work out what has changed in growth expectations, risk appetite and relative returns.
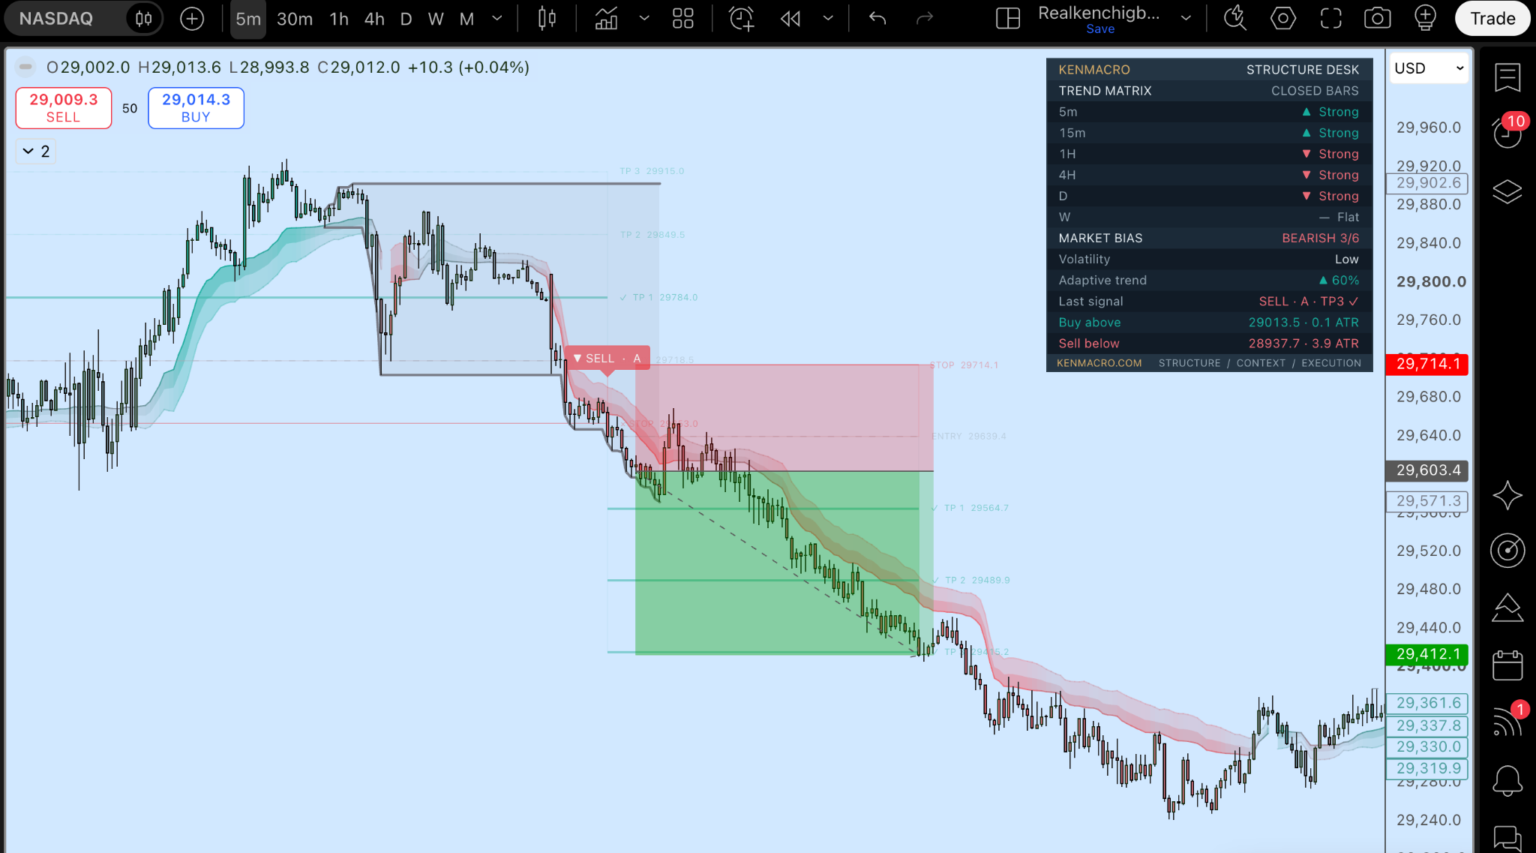
This one is a good example of why the timeframes matter. The 5-minute and 15-minute were still bullish when the screenshot was taken, while the 1-hour, 4-hour and daily were bearish. The panel shows you that conflict directly, so you know you are trading against the short-term flow and can size the idea accordingly.
GBP/JPY: one framework, a different market
The same process applies beyond commodities and indices. On sterling against the yen I am interested in relative interest rate expectations, UK growth and inflation, Japanese monetary policy and the mood around carry trades. Then I look at what price itself is doing: is the structure aligned, where is the invalidation, and what would I need to see before getting involved?
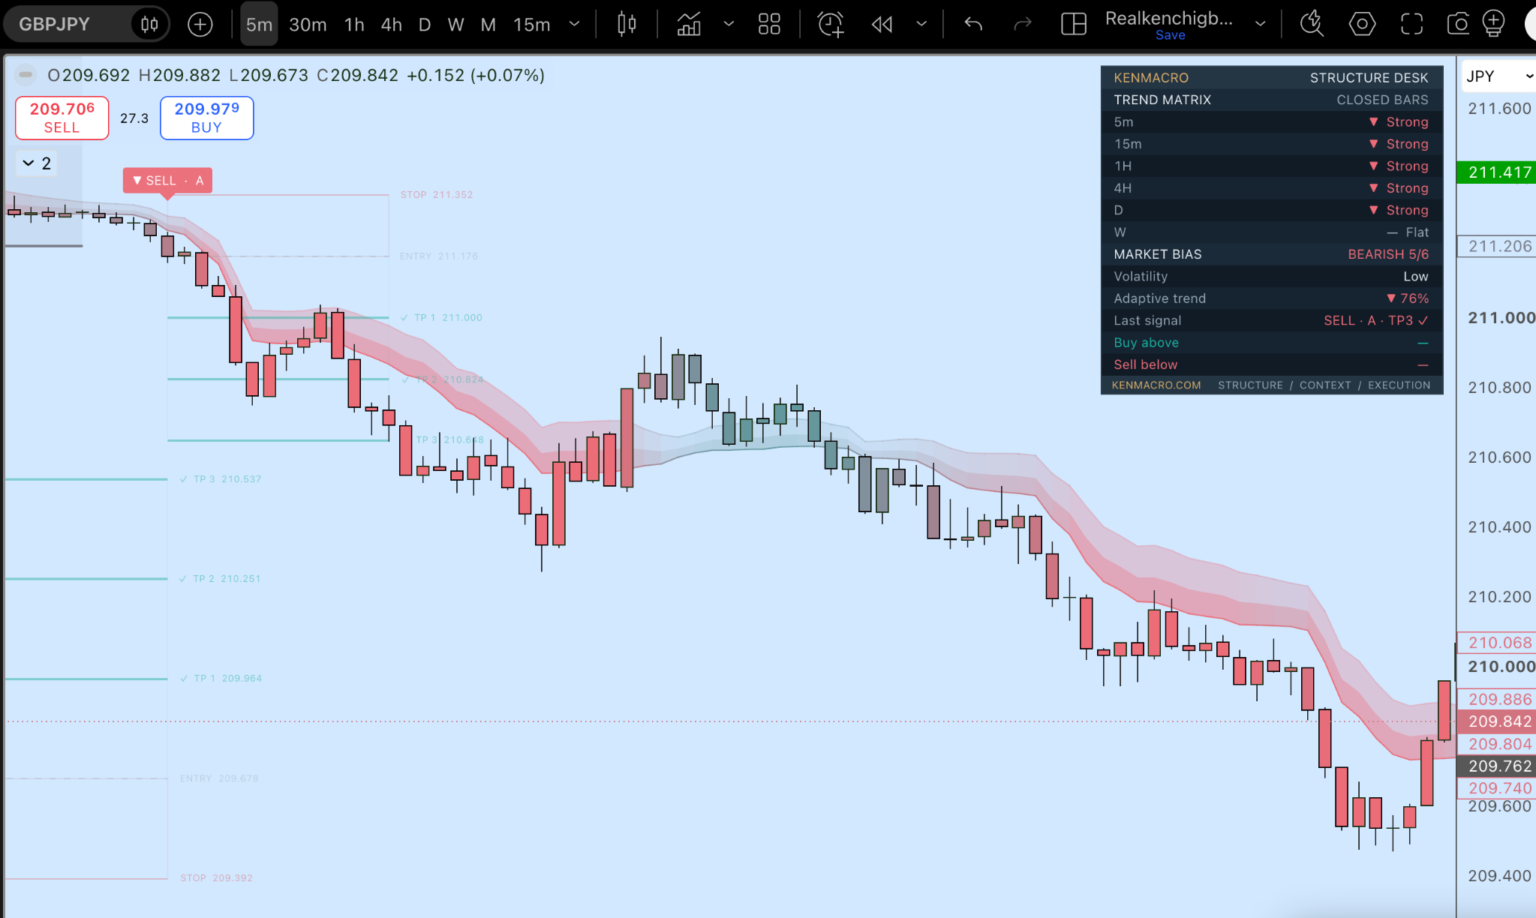
Here the indicator is tracking bearish structure across five timeframes at once. It shows the same tool working on a currency pair without pretending the economic drivers are the same as for oil or gold. The tool is identical; the reasons behind the move are not.
How I actually use the indicator
The panel on every chart tells you a few things straight away: the trend on each timeframe from 5 minutes to weekly, an overall market bias, the last signal and its grade, and the levels where the bias would flip. On the chart itself it labels the structure, the breaks and changes of character, the premium and discount zones, and a planned entry, stop and three targets. The overlay in these screenshots still carries the working name Structure Desk; it is the same tool.
But I never use it on its own. The macro tells me what kind of environment I am dealing with and which side the bigger money is likely to be on. The indicator helps me work out how and where to approach it, and where I am wrong. One without the other is half a process.
Next week: the Fed has an uncomfortable decision to make
The Federal Open Market Committee meets on 27 and 28 October, according to the Fed’s official calendar, with the funds rate at 3.75% to 4.00%. The debate is not simply whether inflation is high. It is how persistent the pressure from energy might become, what activity and financial conditions are telling policymakers, and what markets have already priced in.
Going into that meeting, these are the three things I am watching:
- Oil and the dollar. Is the energy risk premium still rising, and is the dollar reacting to tighter policy expectations or to defensive demand?
- Treasury yields and gold. Are real yields moving because inflation expectations, growth expectations or risk appetite have changed? Does gold confirm the move or diverge from it?
- Equity breadth and Nasdaq structure. Does the market stabilise beyond a handful of large names, or do financing and valuation worries keep spreading?
The numbers are only half the analysis. The market’s reaction tells you what traders were already expecting.
I will cover the full calendar in the Week Ahead on Sunday. For the background to this week’s oil move, read my piece on Trump, Iran and the oil shock before the US midterms, and for the dollar and yields side, the US dollar after September’s CPI.
Frequently asked questions
Why did oil prices rise on 23 October 2026?
Houthi attacks in Saudi Arabia and an oil spill reported by UAE authorities raised fears of further supply disruption. Brent settled at $116.72 a barrel, up 3.14% and its highest close since 29 April, while WTI settled at $103.27.
Why did gold fall when Treasury yields were falling?
Higher oil revived inflation worries and expectations of tighter Fed policy, and the technology sell-off pushed some investors to sell liquid assets to raise cash. Lower yields usually support gold, but the reason yields fall matters, and this week the selling pressure outweighed the support.
What is the KenMacro Structure Indicator?
It is a TradingView indicator that shows market structure, liquidity zones and the trend across timeframes from 5 minutes to weekly, with a planned entry, stop and three targets. It is a planning tool, and the screenshots in this article are illustrations of how it displays a market, not a record of executed trades.
When is the next Federal Reserve meeting?
The FOMC meets on 27 and 28 October 2026, with the decision on 28 October. The federal funds target range is currently 3.75% to 4.00%.
Ken Chigbo is the founder of KenMacro and a macro trader and financial-markets educator with about 18 years in the markets. Through KenMacro he publishes educational analysis on central banks, inflation, interest rates, currencies, gold and commodities, built around understanding the economic forces behind a market before evaluating the chart. Find more research in the KenMacro Macro Insights. About Ken.
This article is general financial-market education and research as at 24 October 2026. It presents dated market observations and the author’s interpretation of macroeconomic developments. It does not constitute personalised investment advice, a trade signal or a promise of future returns. Trading involves risk of loss, particularly where leverage is used. The KenMacro Trading Club is a KenMacro product and the terms on the Club page and at checkout apply.
From the desk, free
Get the macro framework the desk actually trades
The same regime-first framework behind every call on this site. Free. No spam, unsubscribe anytime.
Trading around macro shocks?
Gapping, headline-driven tape punishes the wrong broker setup. Check spreads, execution and the entity you open under before you open an account.
Continue reading
From the desk
Part of the Gold Forecast hub, the desk’s living guide, kept current as markets move.
Where this gets traded
If you trade gold (XAU/USD) around real-yield shifts, CPI or FOMC, execution quality decides the fill. See the KenMacro desk guide to the best brokers for trading gold.
Read the desk guide →