
4 Markets, One Trading Framework: AUD, Oil, Gold and Nasdaq
The sequence I use is the same in every market: macro thesis, market expectations, asset repricing, technical structure, entry conditions, then risk and targets. The four charts below show my KenMacro Structure Indicator at that last stage. It’s a technical confirmation tool, and it isn’t an autonomous profit machine. I don’t use an indicator to tell me what the economy is doing. I use macroeconomics to understand what could drive the market, then market structure and my indicator to help identify where the opportunity and risk may be.
The four charts at a glance
| Market | Chart panel, 30 October | Macro driver this week | What would challenge it |
|---|---|---|---|
| EUR/AUD, 4 hour | SELL A, TP3 marked, bearish 3/3 | Australian CPI and RBA hike pricing | A hold from the RBA, or structure above 1.60520 |
| WTI (USOIL), 4 hour | BUY A, TP2 marked, bullish 3/3 | Shipping attacks and Gulf supply risk | A credible deal, or structure below 99.79 |
| Gold (XAU/USD), 30 minute | SELL B, TP1 marked, bearish 4/4 | Restrictive real rates and ETF outflows | Structure above 4,011.63 |
| Nasdaq price feed, 30 minute | SELL A, TP2 marked, bearish 3/4 | Alphabet, Amazon and Intel results, AI spending | Structure above 29,435.0, with the weekly row still bullish |
What the KenMacro Structure Indicator actually does
The indicator maps swing highs and lows, then labels a break of structure (BOS) when price closes through a swing with the trend and a change of character (CHoCH) when it closes through one against it. When a break passes its filters it prints a signal with an entry, a volatility-based stop and three targets. On these charts TP1, TP2 and TP3 sit at one, two and three times the plotted risk, so a tick means price reached a multiple of the stop distance, not that a forecast came true.
The letter is a filter count across seven conditions: momentum, higher and lower timeframe trend, volume, the breakout, order flow and the trend ribbon. Five or more agreeing prints an A, three or four a B. It isn’t a win probability. The panel’s trend matrix uses closed bars, and the premium, discount and OTE (0.62 to 0.79) zones show where price sits inside its latest swing.
It can’t tell you why a market is moving, whether a headline is true or what a central bank will do next, and it knows nothing about your account or your entry. Spot FX and CFD charts also carry tick volume, not exchange volume. It makes structure and risk easier to read once you have a reason to look.
EUR/AUD: inflation, the RBA and relative rates
Australia’s September CPI, released on 28 October, rose to 4.3% from 4.0% against a 4.2% consensus. The monthly trimmed mean of 3.6%, from a revised 3.5%, was in line, so the hawkish part came from the quarterly series: 1.0% on the quarter and 3.7% on the year, against 3.6% expected. Fuel rose 23.6% on the year, and the ABS tied September’s monthly rise to higher world oil prices, which matters for the oil section.
The RBA cash rate is 4.60% and the next meeting is 2-3 November. Reported pricing for a move to 4.85% jumped from about 60% before the data to around 80-85%. Persistent inflation can support a currency when it lifts rate expectations relative to the other side of the pair, and that’s the mechanism here.
The other side isn’t standing still. The ECB held its deposit rate at 2.50% on 29 October, unanimously, after debating a hike, and a December ECB hike is still reported at about 76%. Christine Lagarde also announced she’ll leave on 7 February 2027. In June I wrote that the AUD was losing its RBA edge. The data has since turned, and the read has to turn with it.
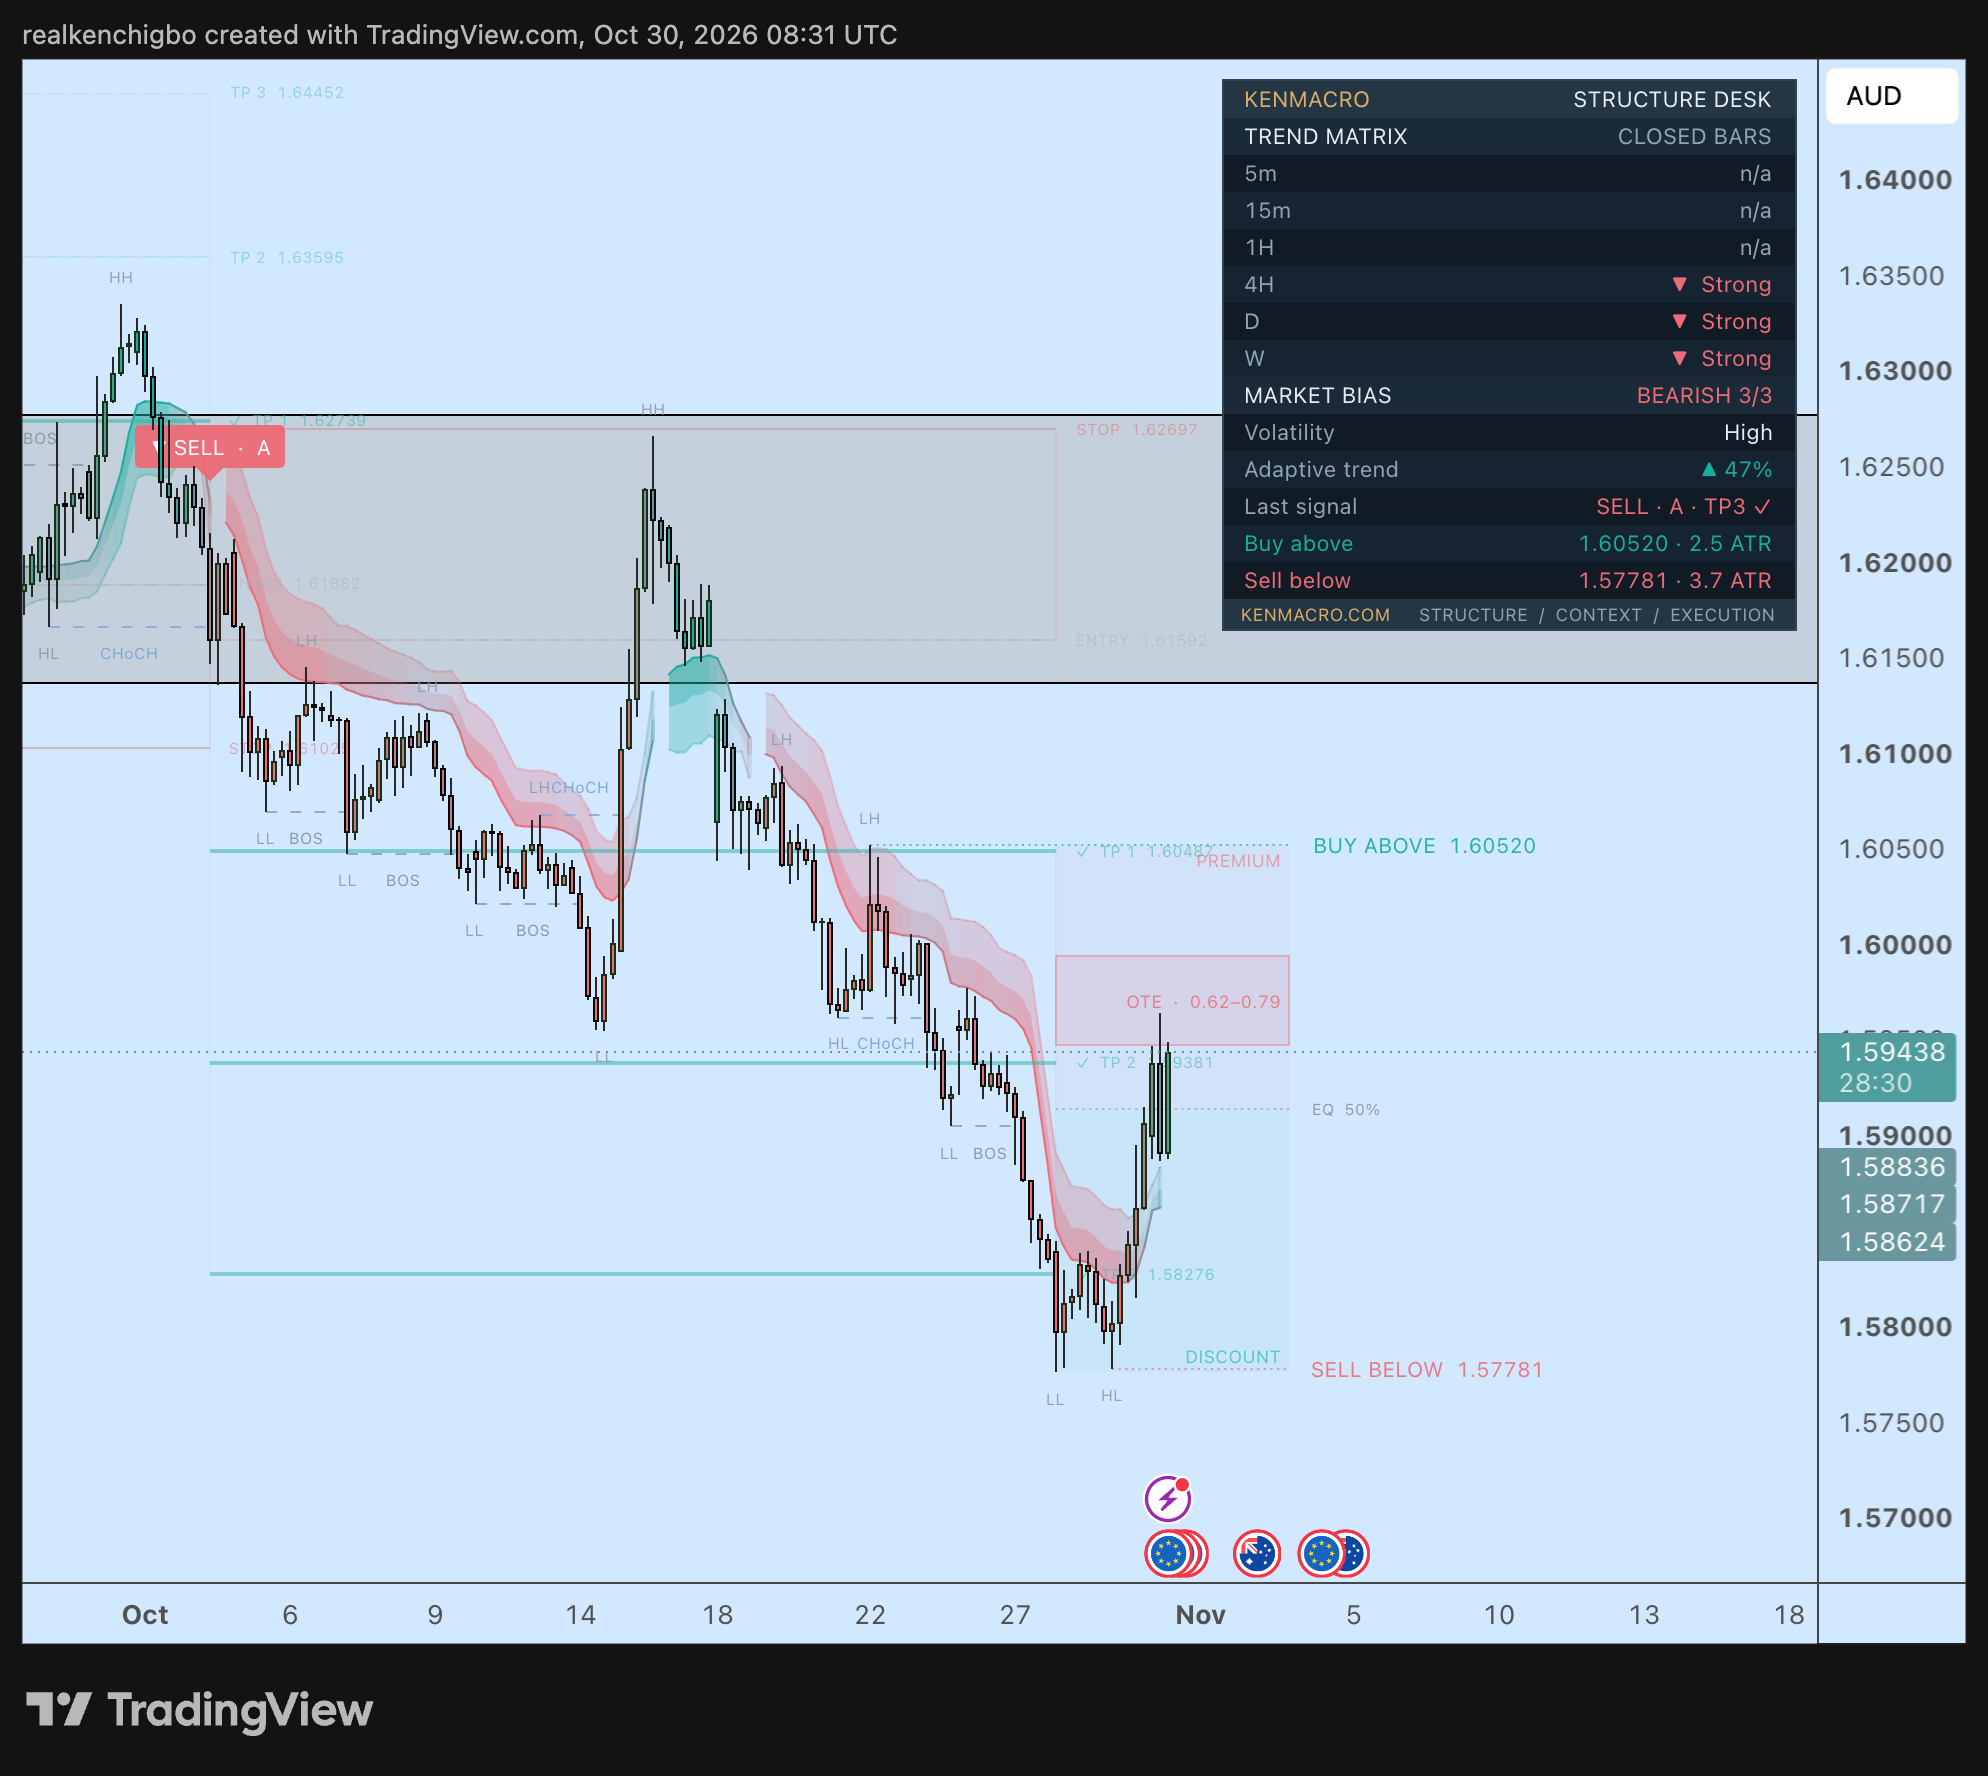
The SELL A printed in early October, around the RBA’s September hike and weeks before this CPI, so the data added to a move already in place. The plotted levels were entry 1.61592, stop 1.62697 and targets at 1.60487, 1.59381 and 1.58276, the last reached around 27 October on the data I checked. It wasn’t smooth: the mid-October rally came within a few pips of that stop on my comparison feed.
Friday needs separating from October. EUR/AUD fell from above 1.61 to a low near 1.578, then bounced to about 1.596, and the screenshot catches it at 1.59438 inside the OTE zone. Roughly half of that bounce was euro strength and half AUD softness on the numbers I have, and I can’t point to one verified cause.
The panel is still bearish 3/3, but it now shows buy above 1.60520 and sell below 1.57781. A hold from the RBA would hit the thesis directly. Even a hike could disappoint if it’s framed as the last one, since Westpac doesn’t expect further moves as its base case.
WTI oil: pricing supply risk before barrels are lost
Attack headlines are easy to overstate, so this section needs precision. WTI settled at $102.00 on Thursday and traded around $103.50 on Friday morning, with a high near $105. Here’s what’s known this week, sorted by strength of evidence.
| Evidence type | What’s on the record |
|---|---|
| Reported attacks | UKMTO reported a vessel on fire near Khasab on 29 October, and a tanker damaged by explosives from a small boat, reported on 30 October. A projectile report may be the same incident. Attribution is unclear. |
| Claims of attacks | The Houthis claimed a missile hit the Ras Tanura refinery on 27 October. Iran’s forces claimed tankers hit mines on an unauthorised route. Both come from interested parties. |
| Confirmed interceptions | Saudi and coalition statements reported missiles intercepted on 27, 28 and 29 October, and a drone on 30 October. |
| Verified infrastructure damage | A fire at the Ras Tanura terminal is supported by NASA satellite heat data and a source quoted by Bloomberg, with the extent unclear. A refinery strike isn’t confirmed. |
| Confirmed production or export losses | I found none for this week. The IEA said Gulf crude exports recovered to over 75% of pre-war levels in September. |
A premium can exist without confirmed lost barrels, because oil prices the probability of disruption as well as the disruption itself. One tracker shows about seven Hormuz crossings a day, around 9% of baseline, although tracking undercounts and exports haven’t collapsed in line with it. US crude stocks are 4% below their five-year average and the IEA expects a deficit through year-end.
A senior Iranian official called Qatar’s draft “unacceptable ideas and not an offer”, though a formal reply is still expected, possibly on Saturday. Politicians discussing peace doesn’t remove the risk. I covered the wider supply picture in my Brent outlook on Tuesday.
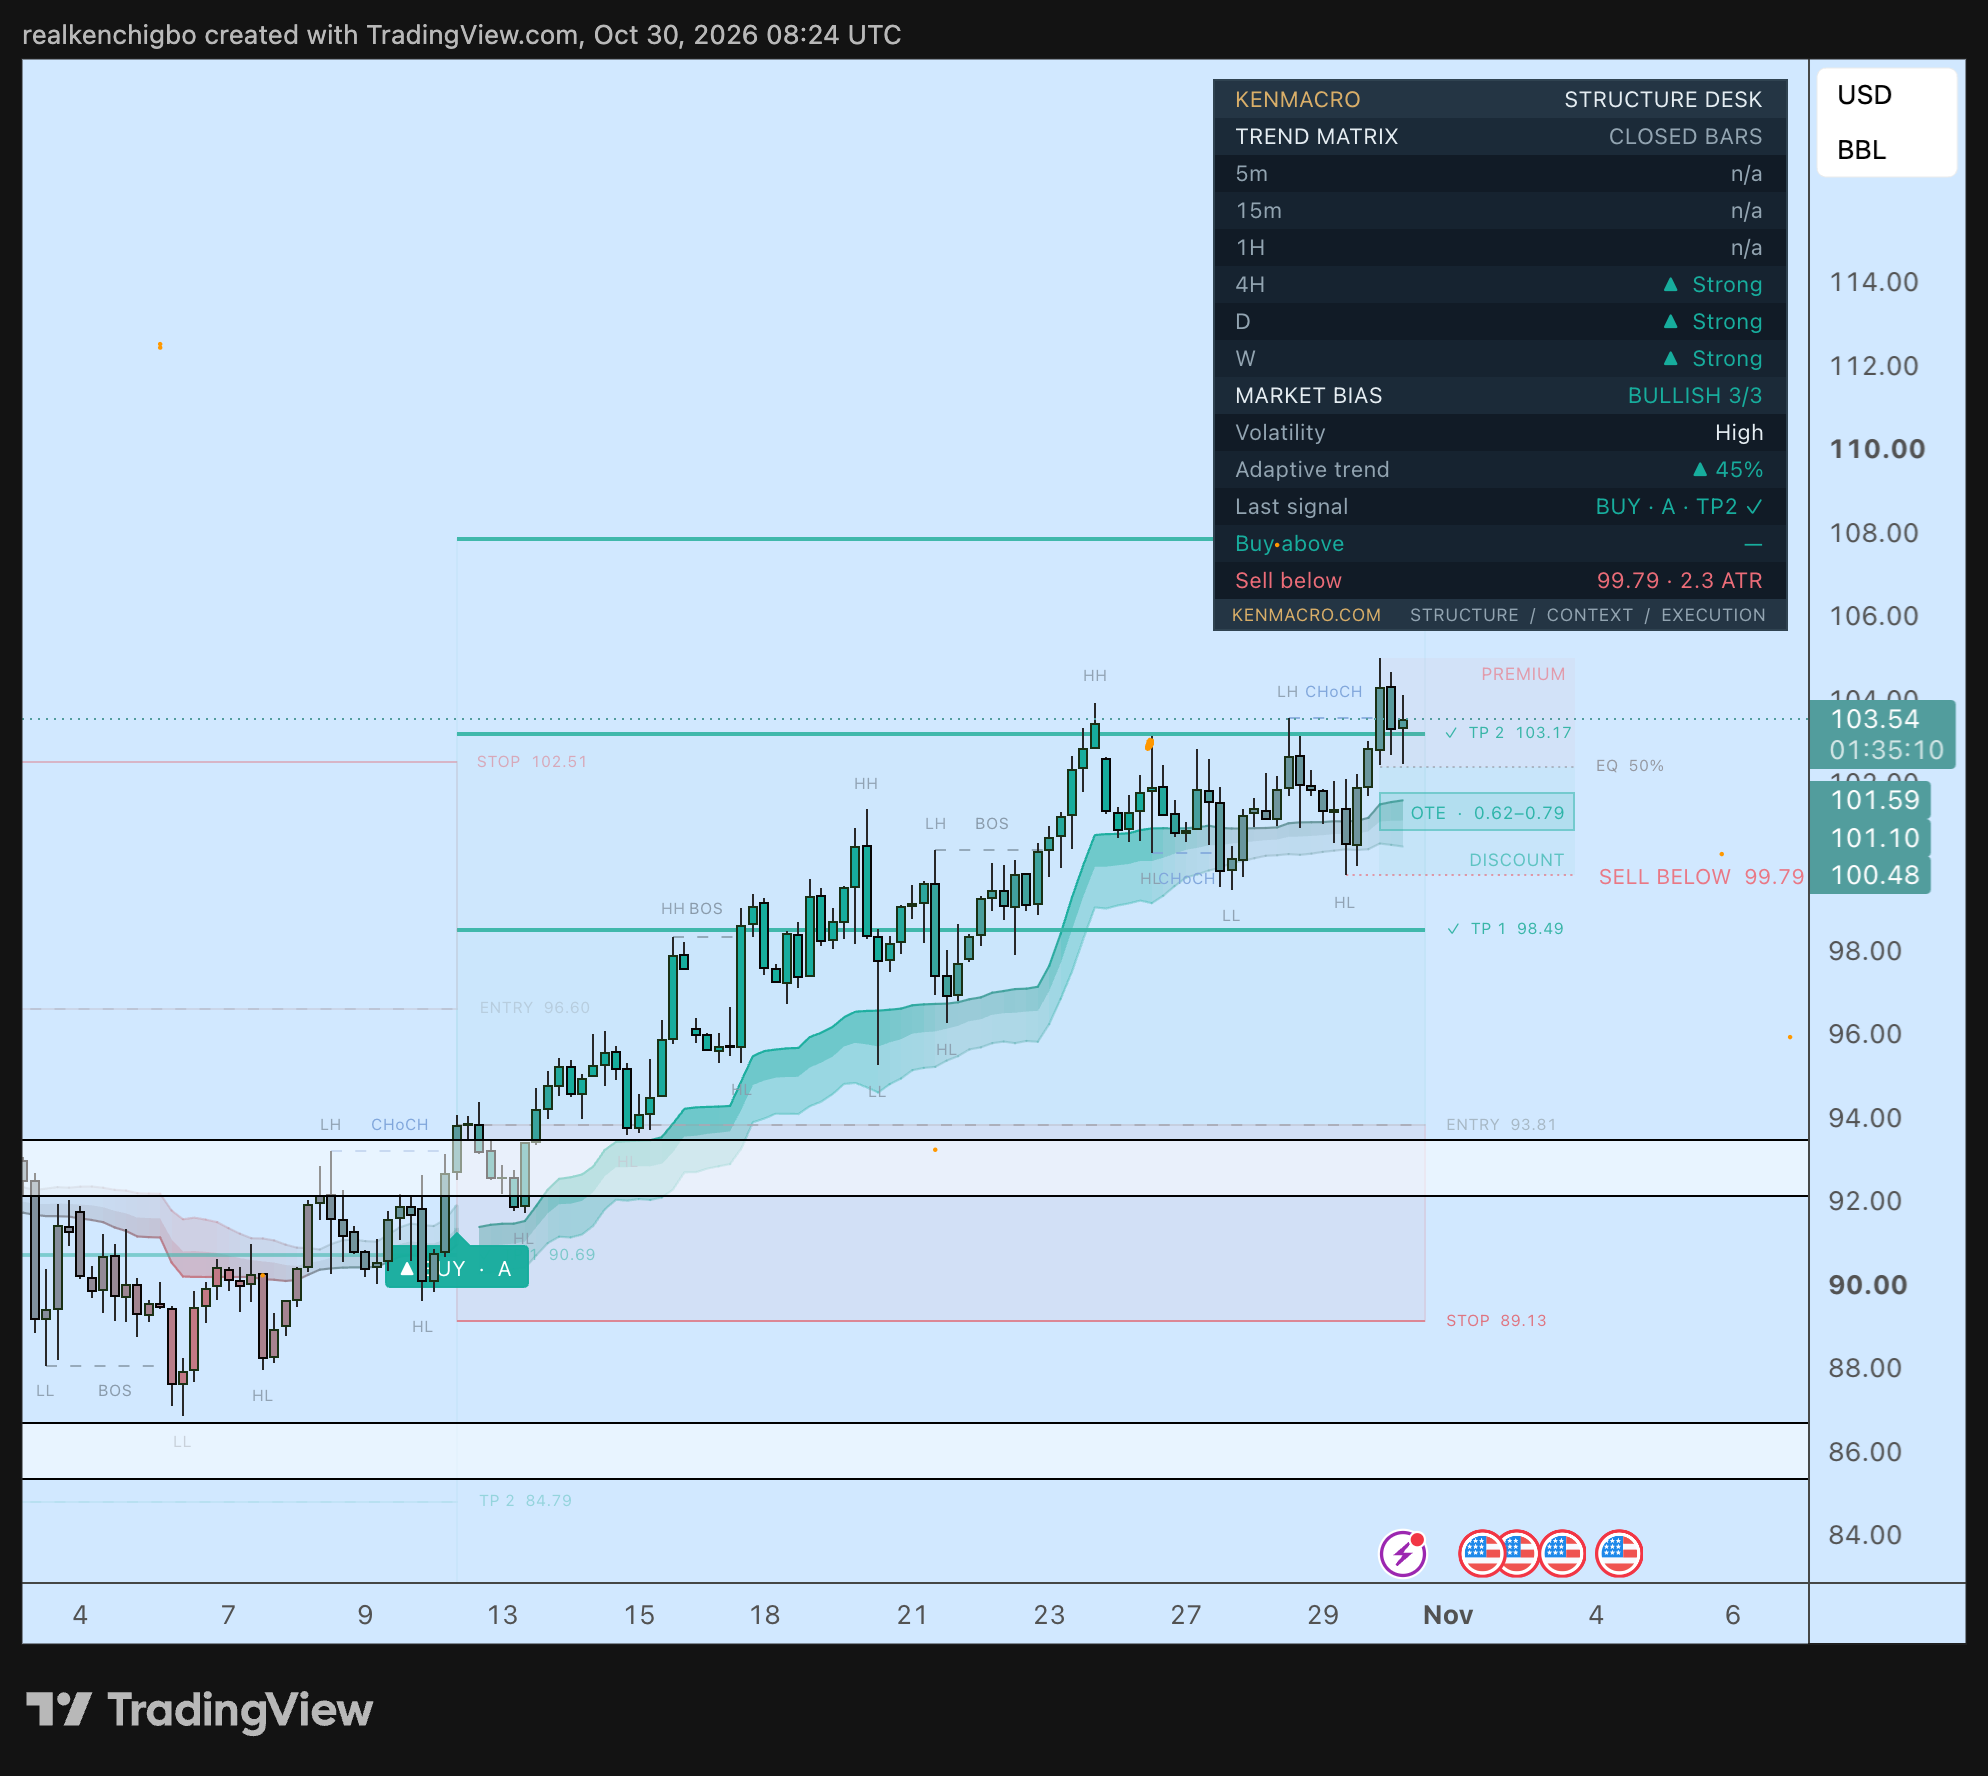
This is the WTI chart, not Brent. The BUY A printed around 12 October with entry 93.81 and stop 89.13. TP1 at 98.49 and TP2 at 103.17 are ticked, and December futures traded those levels around 16 and 23 October. The next plotted target is TP3 at 107.85, not reached and sitting behind the panel in this screenshot. The panel reads bullish 3/3 with sell below 99.79, which is the structural line, and a credible deal could take the premium out quickly.
The $150 and $200 headlines are extreme, conditional supply-shock scenarios, mostly discussed in Brent terms. They aren’t this indicator’s WTI targets or my forecast. CBA’s $150 Brent case in September depended on inventories running low enough to force demand down, and Vitol’s chief executive was reported on 12 October discussing moves towards $200 in an extreme Hormuz disruption. Also watch the Brent roll: the December contract expires today and January is about $4 cheaper, so Monday’s headline price may show a fall that didn’t happen.
Gold: why geopolitical risk didn’t automatically help
Gold pays no yield, so holding it has an opportunity cost, and that cost is high. The 10-year real yield was 2.63% on Thursday, the Fed held at 3.75-4.00% with two votes for a hike, and December hike pricing has run at about 72-84% this week. That’s why a war hasn’t meant a gold rally, with spot about 22% below January’s peak near $5,318. Real yields explained covers the mechanism, and my bond yields piece from 8 October shows how much of this year’s rise was real yield.
This week doesn’t fit neatly, though. On Thursday the 2-year fell to 4.61%, the 10-year to 4.98% and the dollar index slipped, core PCE at 3.1% came in as expected, and gold still fell. On Friday morning gold fell again while hike odds eased to about 72-75%. So a restrictive backdrop explains the missing war bid, but it doesn’t explain this week’s day-to-day selling.
The better-evidenced lines are ETF outflows, about $1.21bn globally in the week to 23 October with provisional US outflows this week. I’ve seen no flow data showing money moved from gold into Treasuries, so I won’t claim it. Yields can fall on a given day while conditions stay restrictive. I go deeper on the record and the mechanism in why gold broke below $3,900.
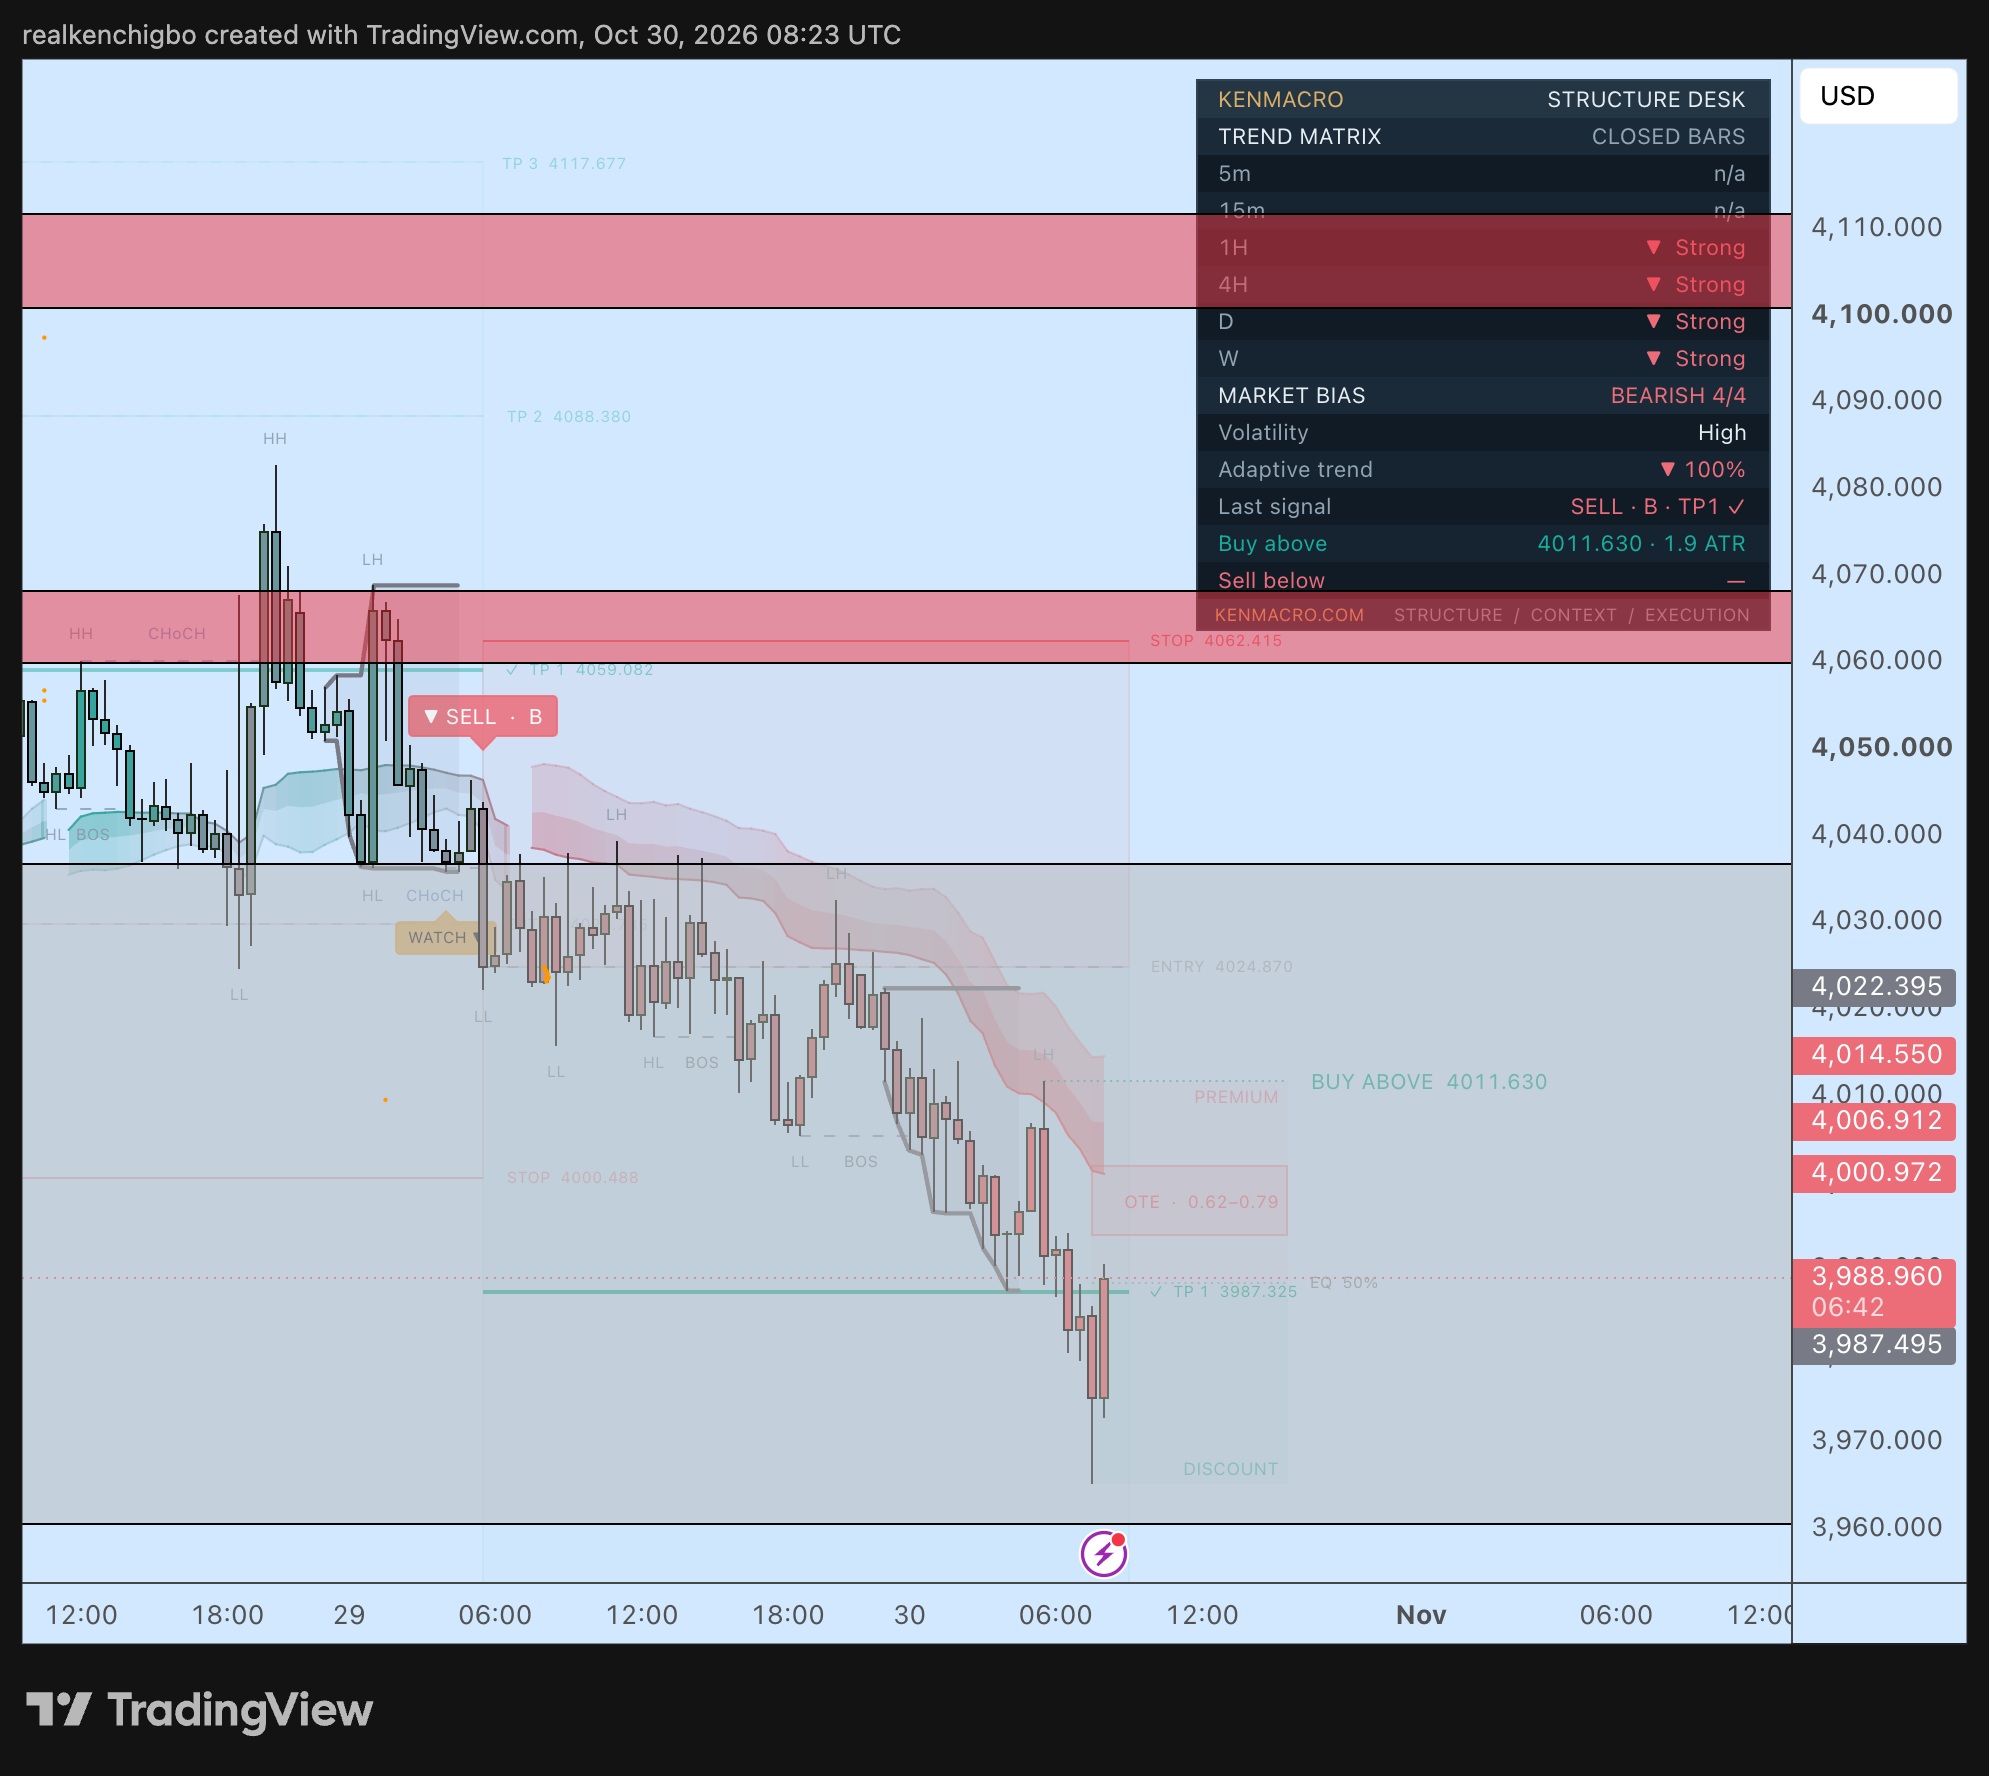
This is a far shorter timeframe, so treat it as an intraday structure read. The SELL B came early on 29 October with entry 4,024.87 and stop 4,062.415, and TP1 at 3,987.325 was marked shortly before the screenshot, consistent with spot near $3,983 at 07:40 GMT. The panel is bearish 4/4 from the hourly up, yet price had already bounced from about 3,965, and buy above 4,011.63 is the level that would challenge the structure. A TP1 on a 30 minute chart says very little about gold’s bigger direction.
Gold’s third target is now marked. Here’s why the macro context mattered.
This morning’s screenshot showed TP1 at 3,987.325 marked on the SELL B from 29 October, which had an entry of 4,024.87 and a stop of 4,062.415. The 16:22 UTC screenshot shows TP2 at 3,949.78 and TP3 at 3,912.235 marked as well, with the panel still bearish 4/4. Those are the indicator’s displayed states on TradingView, not broker fills or realised profits.
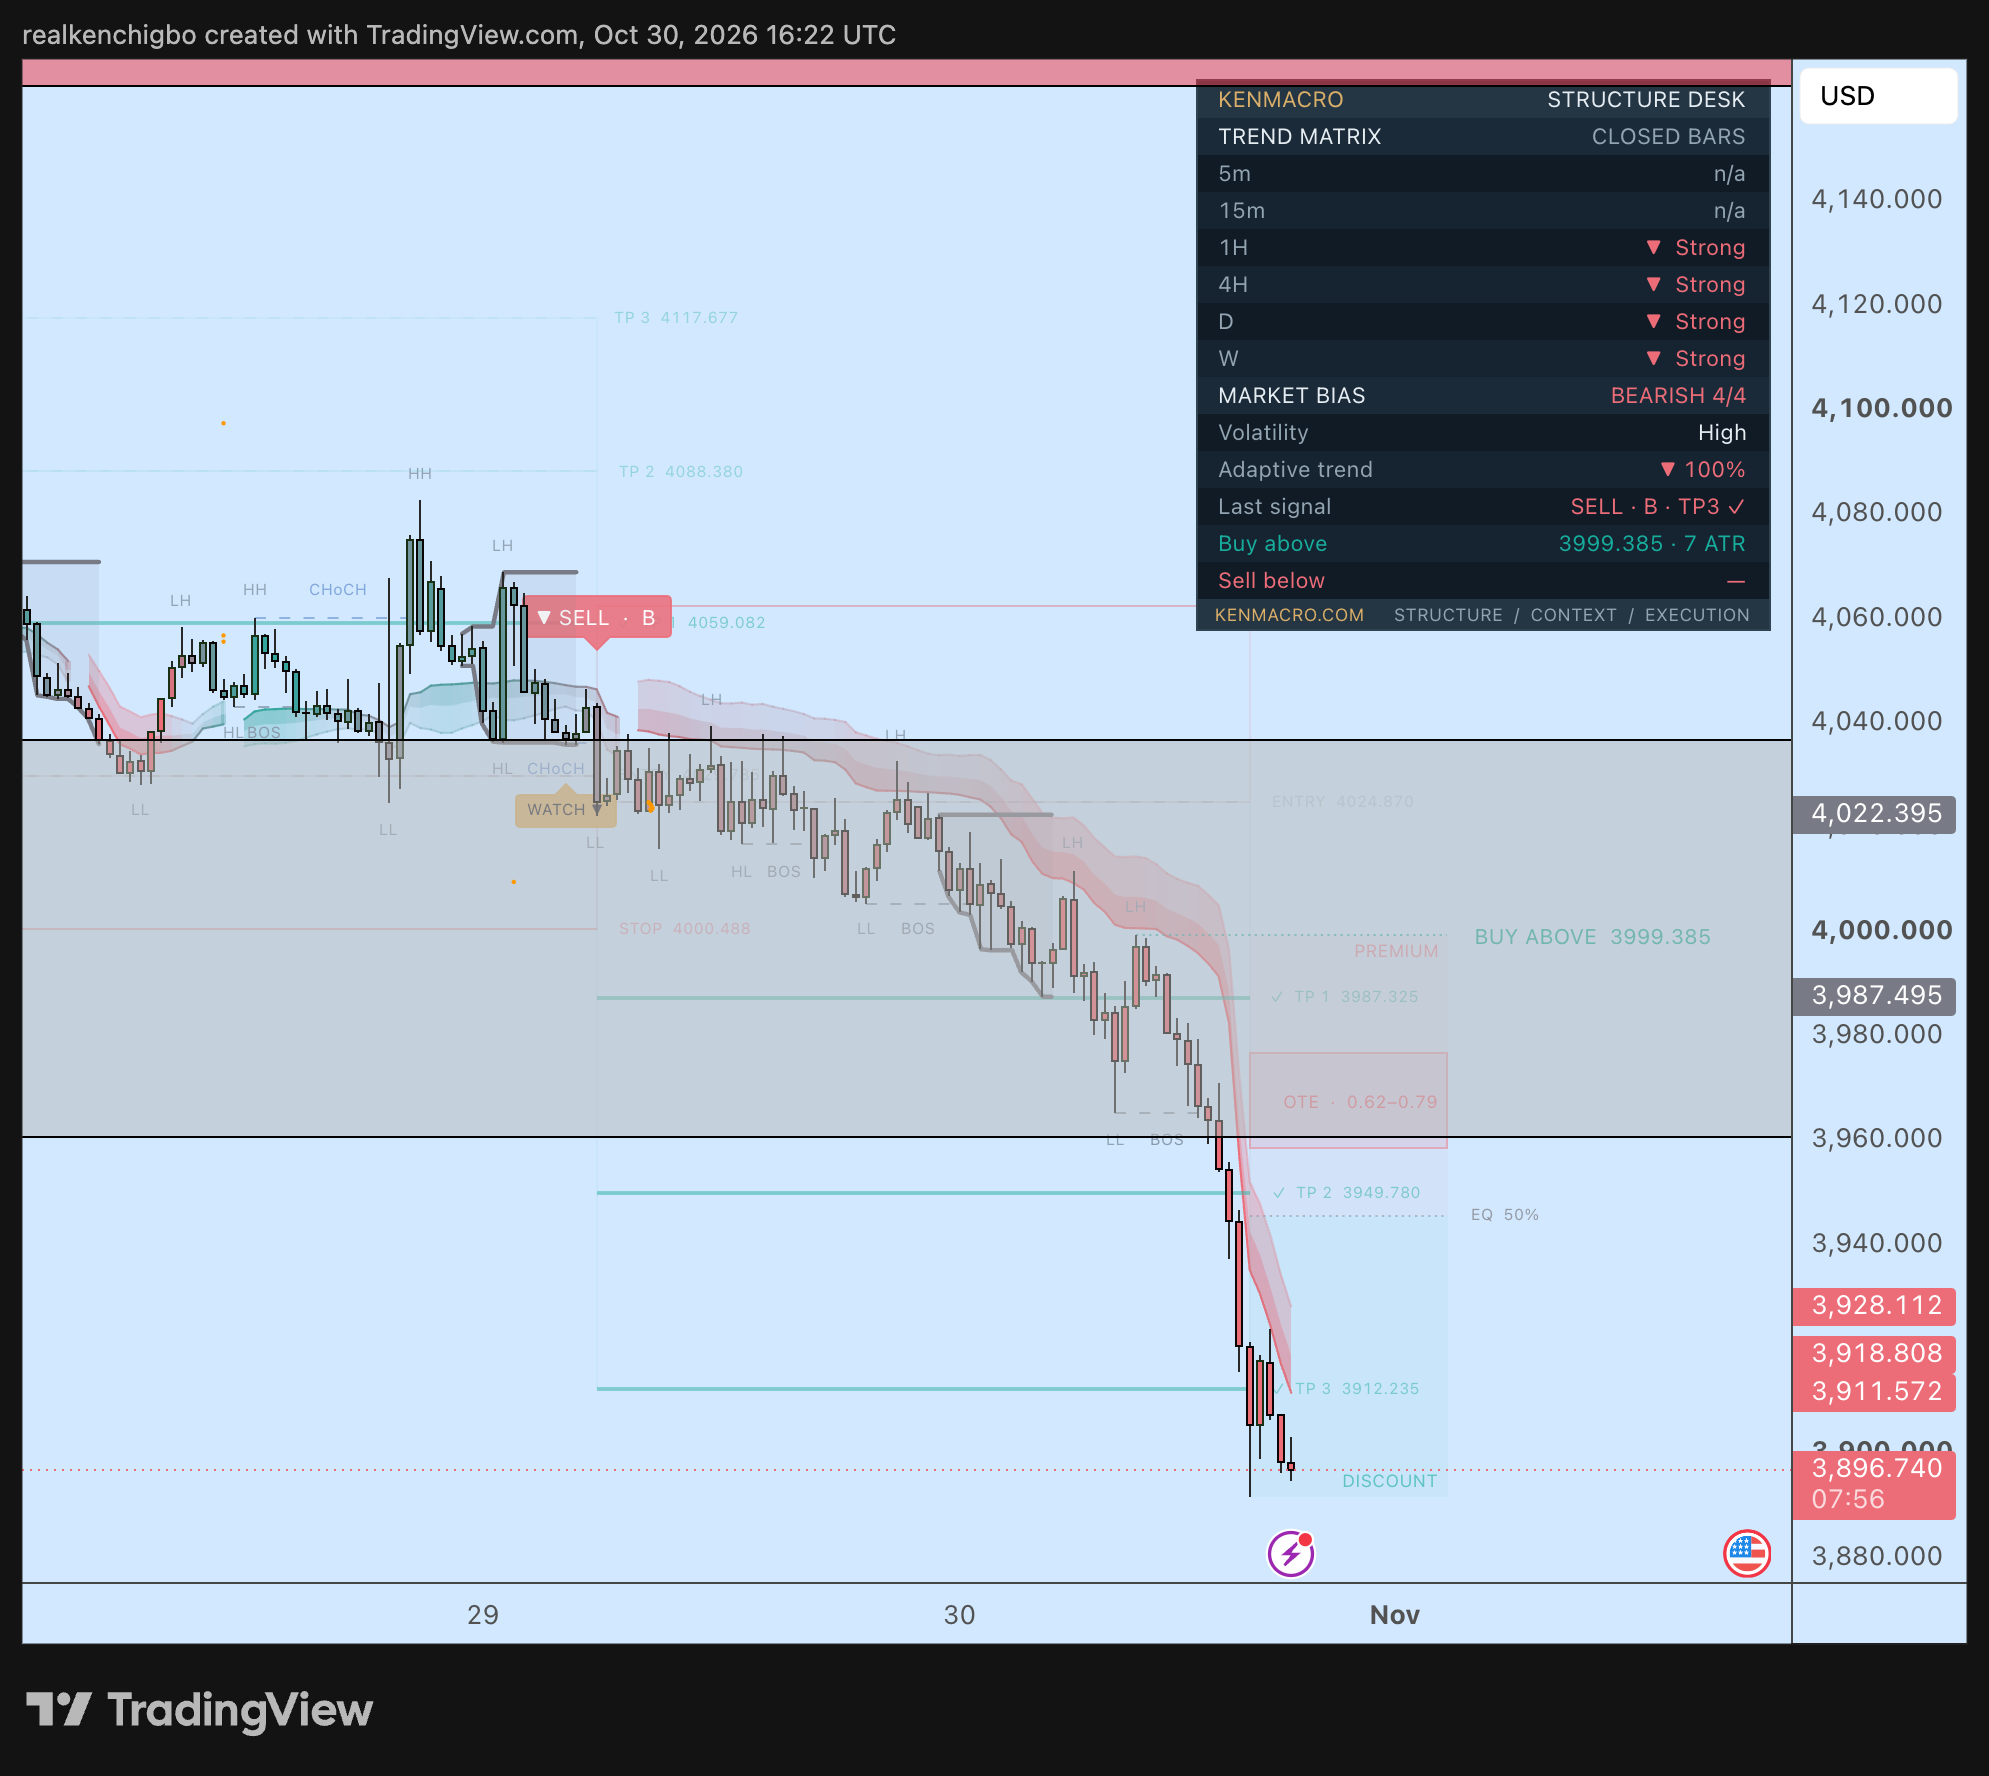
The backdrop behind the setup is the one this section already covers: a 10-year real yield of 2.63% on Thursday, a Fed that held with two votes for a hike, oil keeping inflation risk alive and December hike pricing still high. On Thursday’s stream I said portfolios weren’t going to be built around gold while that held. Restrictive rates and that uncertainty were why I was looking for sells at all.
Friday’s afternoon leg doesn’t fit a simple yields story, though. Around 16:30 UTC the 2-year and 10-year yields were each about 4 to 5 basis points lower on the day on CNBC’s quotes, the dollar index was slightly lower too, and gold was about $124 down. I haven’t seen a confirmed single catalyst for the size of that move, so I won’t name one, and I still see no flow data showing money moved from gold into bonds.
That’s the distinction between macro direction and technical execution. The macro gave the reason to lean bearish, and it can be right for days before price agrees. The structure and the indicator gave the location, the level that would prove the idea wrong and the plotted targets.
Nasdaq: earnings did the damage this week, not yields
Higher real yields can pressure growth stocks, because more of their value sits in distant cash flows. It’s a real mechanism, but it doesn’t explain this week. On Thursday the Nasdaq Composite fell 1.38% to 26,184.72 and the Nasdaq 100 fell 1.38% to 29,402.51 while the 10-year yield dropped 7 basis points. The S&P 500 lost only 0.30%, and AP reported that most S&P stocks rose, with Alphabet’s historic drop doing the damage.
Alphabet closed down 12.64% after results that raised questions about earnings and heavy AI spending. The equal-weight S&P ETF rose 1.20% and the Russell 2000 gained 1.01%, so money was moving inside equities. Amazon and Intel then disappointed after the bell, Nasdaq futures were down about 2% on Friday morning, and Apple reports on Monday.
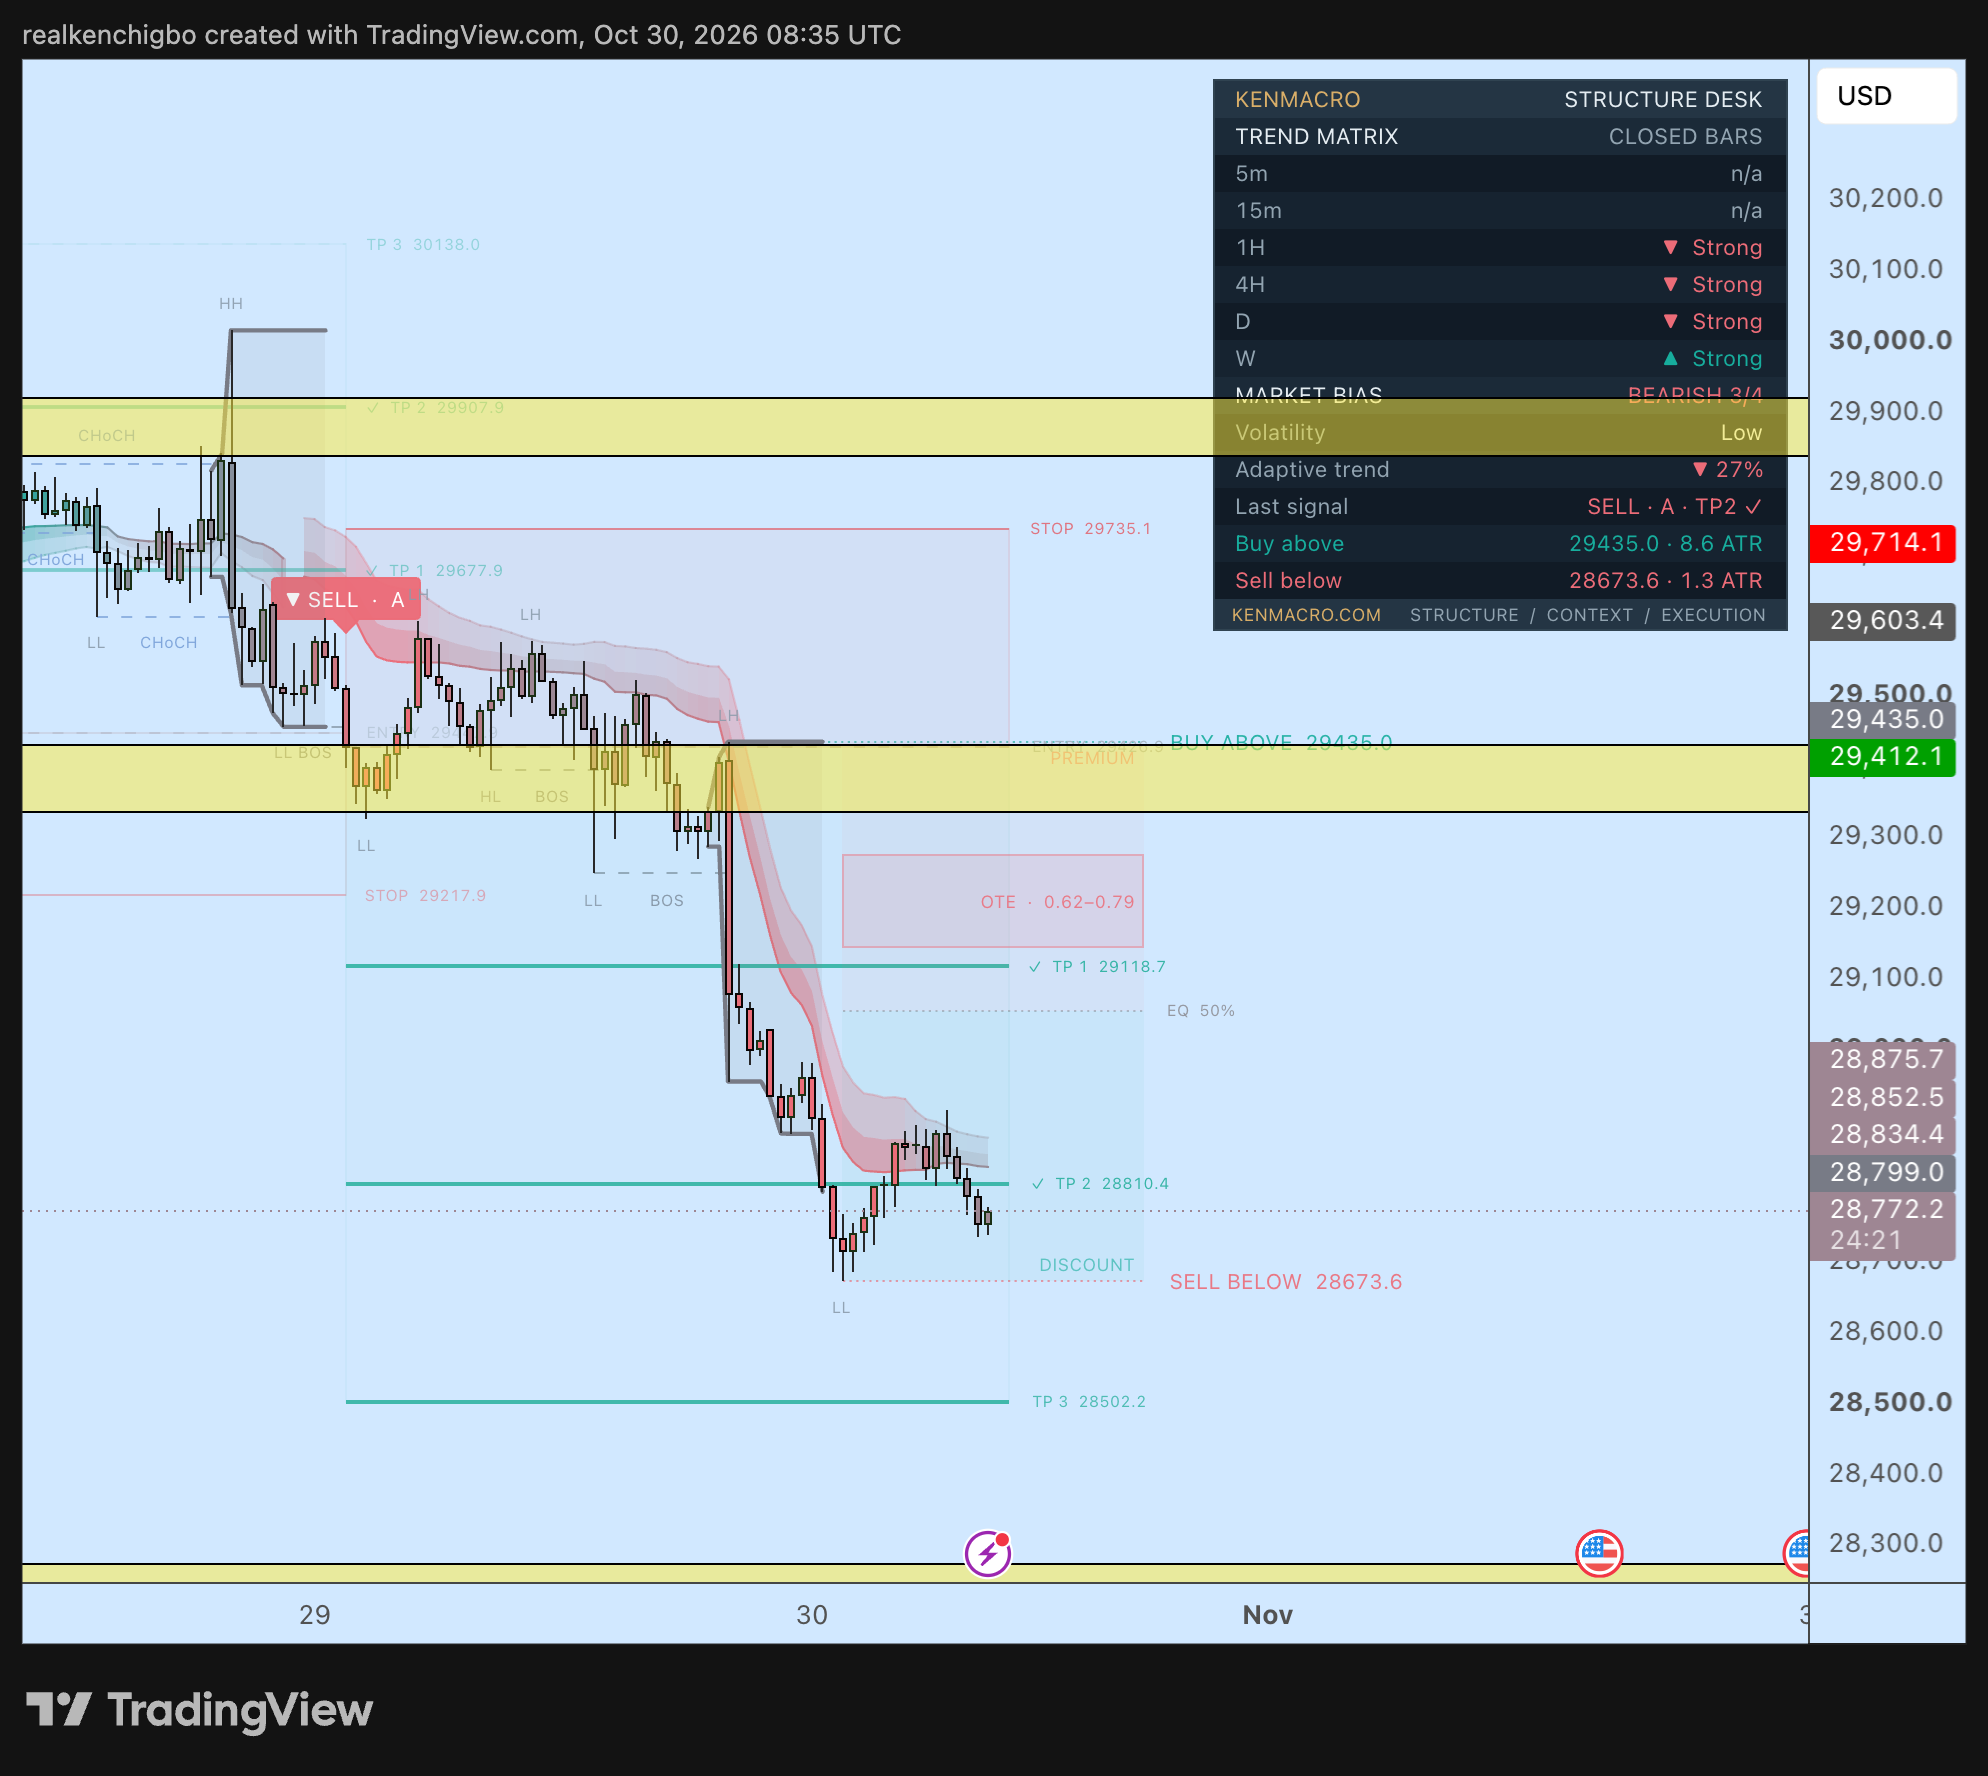
The screenshot doesn’t show its symbol, and at 28,772 it’s plainly not the Nasdaq Composite, which closed near 26,185. The level sits about 150 points under December Nasdaq 100 futures, which points to a Nasdaq 100 based feed. The SELL A printed early on 29 October, after Alphabet’s results had already hit futures, so it confirmed a break and didn’t anticipate the news. TP1 at 29,118.7 and TP2 at 28,810.4 are ticked, and TP3 at 28,502.2 isn’t.
Lower lows and a sharp break from the 29,400 area supported the bearish read. The challenge sits on the panel: bias is 3/4 because the weekly row is still bullish, so this is a short-term sell inside a stronger higher timeframe trend. Buy above 29,435.0 is the level to watch, and with price near sell below at 28,673.6 there’s little room to chase.
What connected all four markets
The useful question each time was the same: what’s changing in expectations, and is price agreeing? The oil shock runs through all four. It lifted Australian fuel inflation and RBA pricing, it supported crude directly, and it kept rate expectations high, which leaves gold with an opportunity-cost problem. For technology it sat in the background, because this week’s trigger was earnings and capital spending.
- Persistent inflation can support a currency if it lifts rate expectations relative to the other side of the pair.
- Supply disruption risk can support crude before any barrel is confirmed lost.
- Elevated expected policy rates can challenge gold, even during a war.
- Discount-rate sensitivity and earnings risk can challenge technology valuations, and you have to check which one is active.
Those relationships are conditional, not permanent rules. This week’s gold and Nasdaq sessions both broke the simple version, because yields fell and both still dropped.
So macro gives you a directional framework and a list of what would prove you wrong. Structure, liquidity and predefined risk handle the execution: where the idea is valid, where it fails, how much you can lose and whether the reward justifies it. You can have the right macro and a bad entry, which is why the two jobs stay separate.
Next up are Iran’s reply, OPEC+ on 1 November, Apple on 2 November, the RBA and the US midterms on 3 November, eurozone flash inflation on 4 November, the Bank of England on 5 November and US payrolls on 6 November. I’ll set those out in the Week Ahead on Sunday.
Where the KenMacro Trading Club comes in
This macro-plus-technical approach is what I’m bringing together inside the Club: the complete technical trading education, the Macro Trading Blueprint and other courses, weekday New York live market analysis, replays and the community. The KenMacro Structure Indicator is planned for members once publishing and member access are operational. Paid enrolment opens on Friday 6 November.
Ken Chigbo is the founder of KenMacro and a macro trader and financial-markets educator with about 18 years in the markets. More research is in the KenMacro Macro Insights. About Ken.
The charts show plotted indicator levels at the time of capture, not personal trades, fills, profits or a performance record. The KenMacro Trading Club is a KenMacro product and the terms on the Club page and at checkout apply.
Get the macro framework the desk actually trades
The same regime-first framework behind every call on this site. Free. No spam, unsubscribe anytime.
Trading around macro shocks?
Gapping, headline-driven tape punishes the wrong broker setup. Check spreads, execution and the entity you open under before you open an account.
Continue reading
From the desk
Where this gets traded
If you trade gold (XAU/USD) around real-yield shifts, CPI or FOMC, execution quality decides the fill. See the KenMacro desk guide to the best brokers for trading gold.
Read the desk guide →