
Gold Broke Below $3,900. Here’s Why I Was Bearish Before the Sell-Off.
What I actually said, and when
| Date | What I said | Gold then | What followed |
|---|---|---|---|
| 4 January | “I said 5K is coming.” Bullish, and dip buying. | Start of the year | Peak close 5,318 on 29 January |
| 8 March | “The dip buying remains on the card.” | About 5,100 | The March fall came next |
| 15 March | “Expect some potential pressure, rejections, and then continuation to the downside.” | 5,062 | 4,605 by 19 March |
| 16 March | Gold rotates “depending on where we’re going with rate cuts or rate rises.” | 5,002 | 4,407 on 23 March |
| 23 April | “At any given moment, gold is going to collapse now, in my opinion.” | 4,724 | 4,558 by 18 May |
| 28 April | “If inflation expectations are rising, we need to look at rate hikes.” | 4,608 | 4,114 by 11 June |
| 11 June | The $4,000 to $3,900 range: “a clean break there opens the door toward $3,500 and $3,300.” | About 4,114 | Spot below 3,900 on 30 October |
| 20 October | “First stop 4K. Take out 4K and the next major liquidity sits at 3,300 to 3,500.” | Above 4,000 | Spot below 3,900 ten days later |
| 29 October | On the live stream: “Gold is still bearish. It’s still incredibly bearish.” | 4,031 close | Down about $124 on Friday |
Why gold can fall during a war
Where I need to refine my own argument
The World Gold Council’s March analysis says “deleveraging and liquidity dynamics, not fundamentals, led the March sell-off in gold.” Global ETFs lost $12bn that month, gold fell 12%, and its model gave smaller roles to the dollar and yields. That was forced selling first, with my rates story behind it.
September cuts the other way. Gold ETFs took in $10bn despite a lower gold price, and holdings hit a record 4,256 tonnes. Money was going in while price went down.
This week is another test. Yields and the dollar fell on Thursday and again on Friday, and gold still dropped, so this wasn’t a story of yields spiking. I haven’t found a confirmed single catalyst for Friday. My read is that it’s the level of rates doing the work, not the daily change.
The rest of the picture matters too. Nominal and real yields aren’t the same thing, and gold has rallied alongside rising yields in other regimes. Treasuries carry price risk of their own, and genuine fear can still bring buyers into gold. Safe-haven demand, real yields and forced liquidation all compete at once, and that’s what makes gold such a demanding macro trade.
For the full mechanism, from oil and inflation through the Fed and real yields to ETF flows and futures positioning, read my explainer on why gold falls during war.
The chart: from TP1 to TP3 in a day
This is the 30 minute gold chart with my KenMacro Structure Indicator. Early on 29 October it printed a SELL B with entry 4,024.870 and stop 4,062.415, so each target sat about $37.50 further down. Price had been making lower highs and lower lows, and the panel showed bearish 4/4 across the hourly, 4 hour, daily and weekly.
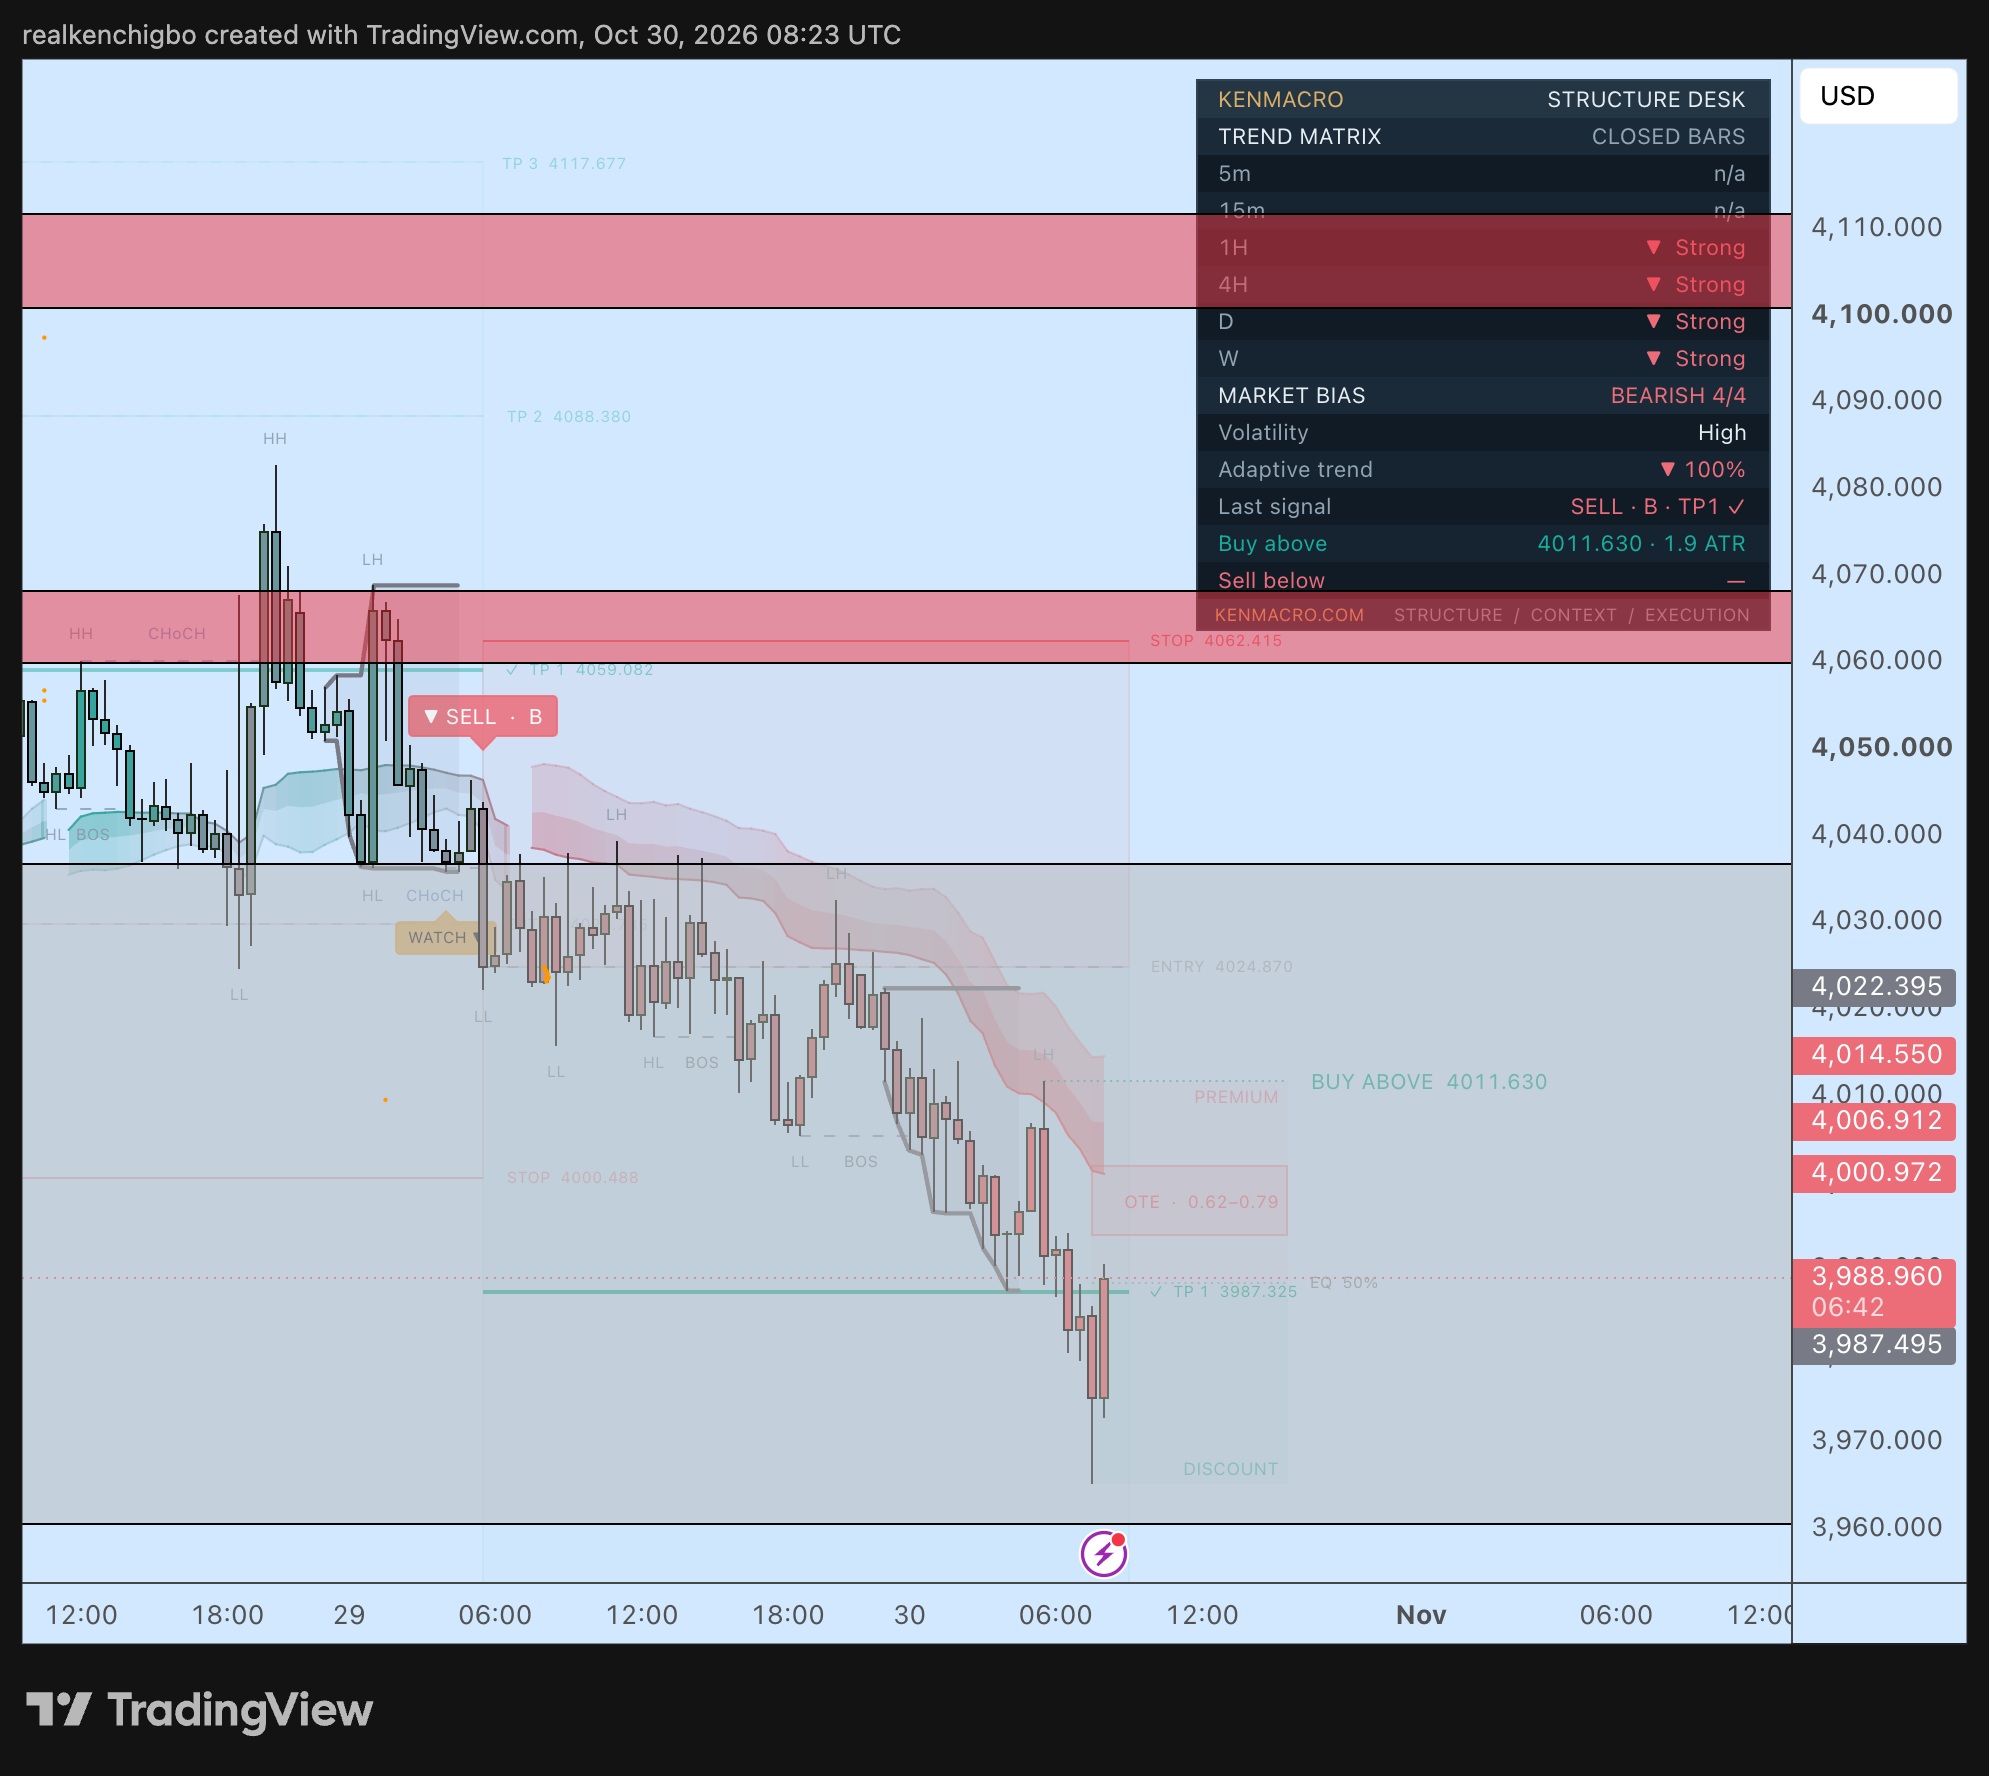
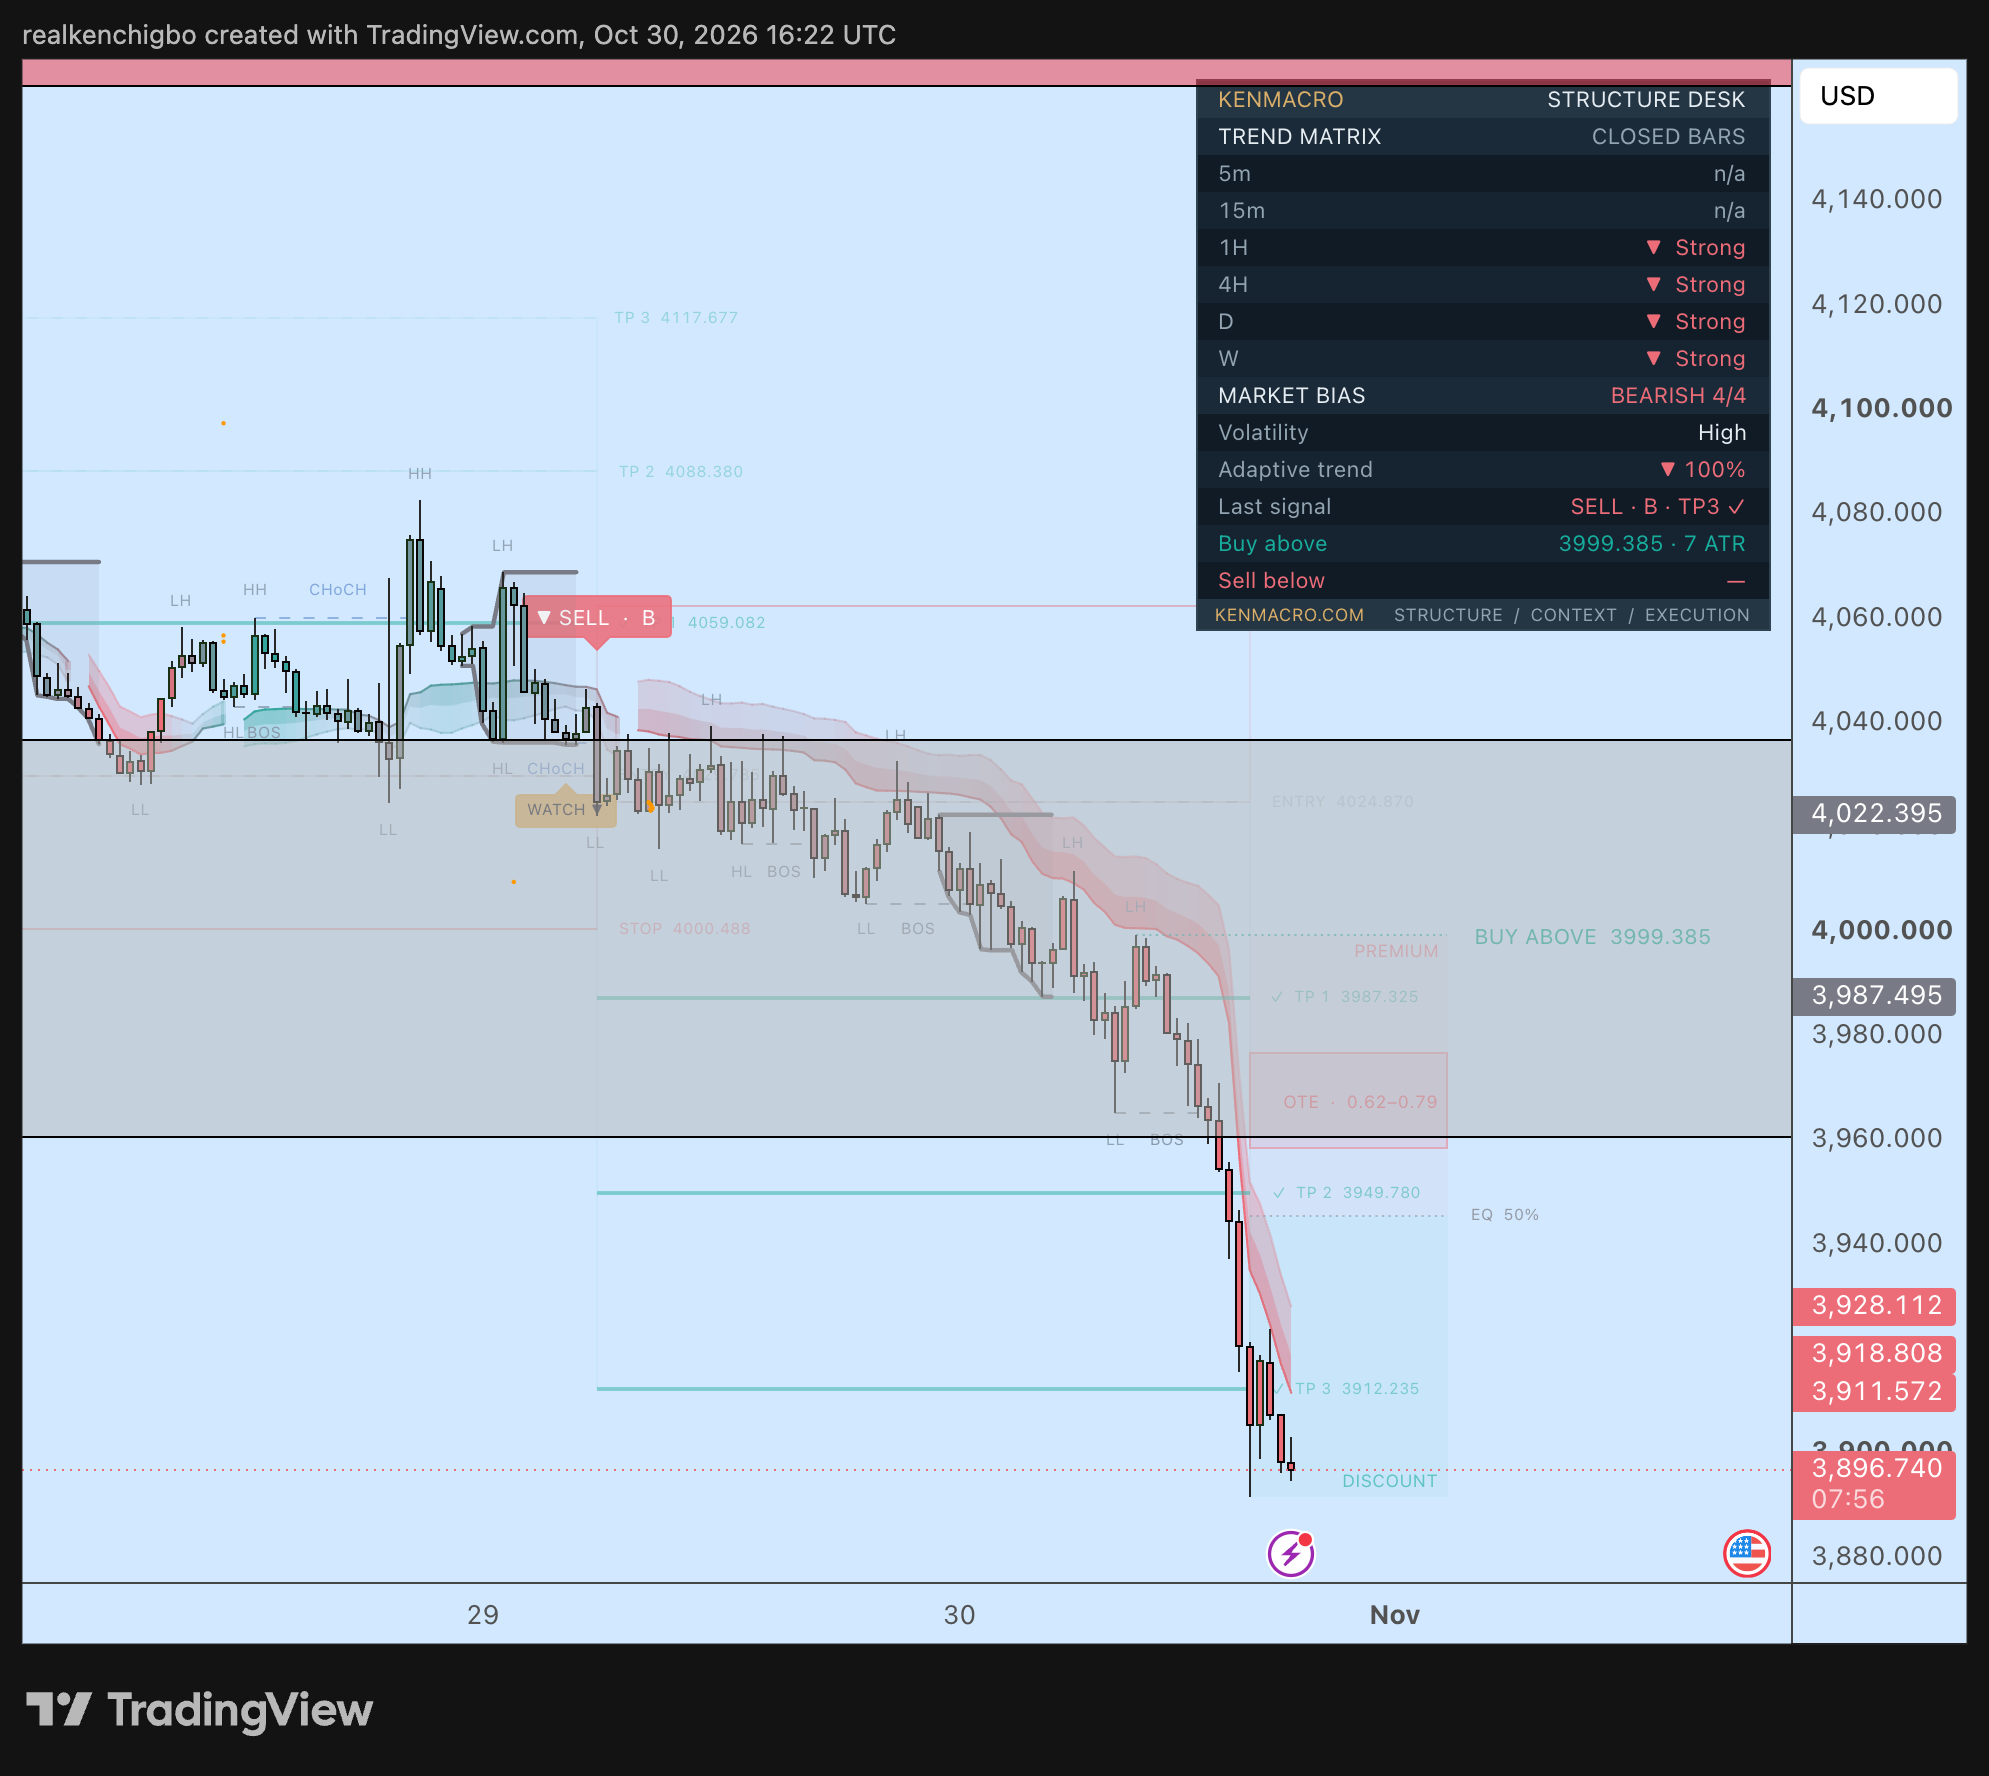
At 08:23 UTC the panel read SELL B, TP1. By 16:22 UTC it read SELL B, TP3, with TP2 at 3,949.780 and TP3 at 3,912.235 both ticked. A plotted target being reached isn’t a fill, a trade record or a profit. It means price traded through a level.
The point is the combination. The macro view came first, and the structure gave it a location, a stop and a place to be wrong.
Where gold goes next, and what would prove me wrong
Here’s what has happened: spot traded below $3,900 on Friday. On futures the low I’d seen at the time of writing was $3,900.9, so I want to see how the week closes before calling it a confirmed break.
Here’s what hasn’t happened: $3,500 and $3,300 haven’t been reached, and spot is still nearly $400 above the first of them. They’re the scenario I set out in June and repeated this month. A clean break opens that door, and it doesn’t mean price walks through it.
The first line for me is $4,000. The chart’s buy-above level was 3,999.385 at 16:22 UTC, so a move back through that would change the short-term picture. Continuation would need failed retests from below and no sign of forced selling drying up.
The bearish view weakens if these start to show up:
- Real yields fall and stay down. A two-day dip doesn’t count, a sustained move from 2.63% does.
- The Fed repricing fades. December hike odds have already slipped from about 84% this week, so I’m watching that closely.
- The dollar weakens and gold rises with it. Gold hasn’t taken any help from a softer dollar this week.
- Real demand comes back. Another month of ETF inflows like September, or stronger institutional and physical buying.
- Liquidity conditions change. If the forced selling is done, price should reclaim levels and hold them.
Why, where and how much
This is the part I’d want every trader to take away. Macro tells you why a market may move. Structure tells you where an opportunity might exist. Risk management decides whether the view can be expressed at all, and at what size.
My indicator sits in the second step. It maps multi-timeframe direction, higher highs and lower lows, changes of character and breaks of structure, supply, demand and liquidity areas, and planned entry and stop areas with TP1, TP2 and TP3. It won’t tell you what the Fed will do, and it can’t make a trade safe. You still need a reason to be looking.
The same process on the Aussie dollar
Gold isn’t the only example. I’ve been on the AUD rate divergence since at least March 2026, when I said on 10 March that the RBA had been hiking while other major central banks were in a cutting cycle. I then wrote in June that the AUD was losing its RBA edge, because views should move when the data does.
The RBA has since hiked again to 4.60%, and September CPI came in at 4.3% with the trimmed mean at 3.6%. Compare that with 3.75-4.00% at the Fed and 2.50% at the ECB, and you can see why relative policy matters more than any one central bank.
| Pair | 30 October | Year to date | 12 months |
|---|---|---|---|
| AUD/CAD | 0.9813 | +7.2% | +7.2% |
| AUD/NZD | 1.2464 | +7.5% | +9.2% |
| AUD/CHF | 0.5781 | +9.1% | +10.1% |
| EUR/AUD | 1.5904 | -9.5% | -10.0% |
| GBP/AUD | 1.9074 | -5.3% | -5.0% |
Gold and the Aussie teach the same thing. A macro thesis can build for months before the technical opportunity is worth taking. For the wider cross-asset picture this week, read my four-market breakdown and why bond yields have been rising.
Why this matters for 2027
Don’t wait until the next major move is obvious. By the time gold’s break is on every headline, the work behind it is months old. These are the macro regimes we’ll be preparing for together inside KenMacro Trading Club as we head into 2027.
I’m not selling chart signals. The Club is an educational environment where you learn what’s driving the market, build your technical execution and follow the macro picture as it changes. It’s preparing to open, and I won’t give an opening day until billing, indicator delivery and the other essentials are confirmed.
- Full macro and technical trading education, including the Macro Trading Blueprint and other courses.
- The KenMacro Structure Indicator, once member access is live.
- Monday to Friday New York market sessions at 14:00 UK, once operating.
- Replays and the member community.
The first 100 paying members get $59/month, retained while continuously subscribed. The waitlist is free and it’s how you’ll get the opening details.
Get the macro framework the desk actually trades
The same regime-first framework behind every call on this site. Free. No spam, unsubscribe anytime.
Trading gold?
Your broker route matters more than most traders realise. Spreads, execution and the entity you open under all change your edge on XAUUSD. Check the route before you fund.
Continue reading
From the desk
Part of the Gold Forecast hub, the desk’s living guide, kept current as markets move.
Where this gets traded
If you trade gold (XAU/USD) around real-yield shifts, CPI or FOMC, execution quality decides the fill. See the KenMacro desk guide to the best brokers for trading gold.
Read the desk guide →