
S&P 500 Flat, Dow Records High as Nasdaq Sinks Jul 2
The tape split three ways today. The S&P 500 closed dead flat, the Dow ripped to a fresh record high, and the Nasdaq 100 got taken behind the shed. That is a rotation print, not a risk-off print, and the payrolls miss underneath it is why.
By Ken Chigbo · Founder, KenMacro · 18+ years in markets, London trading floor and institutional FX
Quick Answer
- ☐ S&P 500 closed at 7483.24, unchanged on the day (Yahoo Finance, 2026-07-02 close).
- ☐ Dow Jones closed at 52900.07, up 1.14%, a fresh record close (Yahoo Finance).
- ☐ Nasdaq 100 closed at 29329.21, down 1.61%, the underperformer by a mile (Yahoo Finance).
- ☐ Non-farm payrolls printed 114K vs 114K forecast vs 172K prior; unemployment 4.3% vs 4.3% (ForexFactory).
- ☐ DXY sank 0.50% to 100.884, USD/JPY dropped 0.94% to 161.101 as the dollar slid across the board (ForexLive wrap).
- ☐ Gold ripped 1.61% to $4,133.7, silver +2.06% to $61.32 on the rate-cut re-pricing.
- ☐ VIX closed at 16.2 (-2.35%), the vol regime is low, this was rotation and not fear.
Jump to section
- The S&P 500 close in one paragraph
- The payrolls print that changed the day
- Why the Dow ripped while Nasdaq cracked
- The dollar and yields under the hood
- Meta, Tesla and the AI spend problem
- Gold and silver ripping alongside the rotation
- Breadth, sectors and the S&P 500 internals
- Cross-asset impact dashboard
- Scenario map into next week
- Key levels worth watching
- What is next: catalysts into the next session
- What would invalidate this view
- FAQ
The S&P 500 close in one paragraph
Here is what actually happened. The S&P 500 finished at 7483.24, a rounding-error move that hides one of the sharper index rotations of the year. The Dow Jones Industrial Average closed at 52900.07, up 1.14%, printing a fresh record high on the session. The Nasdaq 100 closed at 29329.21, down 1.61%, cracking hard as mega-cap AI names got sold. The VIX drifted lower to 16.2, a 2.35% decline on the day, so the tape internals were not screaming panic. This was a domestic-cyclical bid alongside a growth-tech distribution, both catalysed by the same macro trigger.
The market is pricing a re-rated Fed path. The July FOMC just moved from a coin-flip into something closer to a live cut in the OIS strip, and the assets that benefit from cheaper money that are NOT priced-to-perfection on AI capex got the bid. Everything with a heroic 2027 earnings assumption embedded in it got a small haircut. That is the tape in one sentence.
The payrolls print that changed the day
Non-farm payrolls at 12:30 GMT landed at 114K headline, matching consensus at 114K but printing well below the 172K prior read (ForexFactory calendar). Average hourly earnings came in on the screws at 0.3% month-on-month against 0.3% forecast. Unemployment held at 4.3%, in line with both forecast and prior. On the number itself, this is a soft-but-not-recessionary print. The trend line matters more than the single data point. The three-month average has now decelerated meaningfully, and the labour market is loosening at the pace the Fed’s own projections said it should.
The dollar wrap from ForexLive was on it in minutes: “US dollar slides as non-farm payrolls miss” (ForexLive Americas wrap, 20:04 GMT). The market’s read was unambiguous. DXY sold off 0.50% into the close at 100.884, USD/JPY dropped a full 94 basis points to 161.101, GBP/USD ripped 0.73% to 1.3347, and gold detonated to the upside on the softer dollar and lower yields. The equity read followed the same logic. Rate-sensitive value and cyclicals in the Dow, from industrials to financials to healthcare, got the bid on a lower discount rate. Meanwhile the Nasdaq 100 could not hold the tape because its own domestic-capex story is under a separate cloud, which we will get to.
For the framework on how payroll surprises transmit through to yields, the dollar and equity index dispersion, our interest rates explainer lays the full transmission chain out step by step. The read today is the textbook version of that chain running in real time. The MACRO MASTERY desk covered the NFP release live as the print landed, and the rotation call was on the tape within minutes.
Why the Dow ripped while Nasdaq cracked
This is the piece most retail feeds got wrong today. When you see the Dow at a record high and the Nasdaq down 1.6%, the temptation is to call it a “risk mixed” tape and move on. That misses the mechanic. The Dow is not the Nasdaq’s little sibling. It is a price-weighted basket of thirty large industrial and financial names with almost no direct AI hyperscaler exposure. When rates get re-priced lower, the Dow’s constituents, banks, industrial cyclicals, healthcare, consumer staples with heavy leverage, get a direct earnings tailwind on the discount rate. That was the driver behind the 600-point rip flagged by Kobeissi Letter at 20:05 GMT: “The Dow surges nearly +600 points and closes at its highest level on record.”
The Nasdaq 100 tells the opposite story. Its top ten weights are a concentrated bet on AI infrastructure spend. When Zuckerberg tells his own staff at an internal town hall that “AI spend puts strain on the company and the stock price would be higher without it” (Financial Juice, 19:55 GMT), that is a signal the smart money reads instantly. Add to that The Information’s report that “Tesla caps employee AI spend at $200 a week” (Financial Juice, 19:15 GMT), and the market is being handed two headlines in the same afternoon that say “the AI capex arms race has a cost that is starting to show on the P&L”. Mega-cap tech got sold.
Put both pieces together and you get today’s tape. Same macro tailwind, two very different equity outcomes based on sector composition. That is not risk-off. That is capital rotation of the exact kind our risk on risk off framework flags as a “regime pivot” print. The index-level headline is misleading unless you unpack the internals.
Here is the move most people miss. Fund the desk broker (a £500, or $500, qualifying deposit) and you get the live AI Macro Desk AND the £499 Macro Trading Blueprint course, both for life, free. The whole system, for funding a trading account you would open anyway. Prefer to learn first? Grab the free framework here.
The dollar and yields under the hood
The dollar wrap is the cleanest read of the day. DXY closed at 100.884, down 0.50%, giving up the 101 handle it had been defending intraday. The move was broad-based across the majors:
- EUR/USD +0.20% at 1.1436
- GBP/USD +0.73% at 1.3347 (the standout of the majors)
- USD/JPY -0.94% at 161.101 (yen the biggest beneficiary of the yield re-pricing)
- USD/CHF -0.66% at 0.8034
- AUD/USD +0.14% at 0.6923
- NZD/USD +0.40% at 0.5698
- USD/CAD -0.17% at 1.4181
The USD/JPY move is the tell for the yields story. When the yen catches a 94 basis point bid on the day, that is a US-real-yield transmission and not a Bank of Japan story. Rates in the US came in on the payrolls miss, the carry on the trade shrank, and USD/JPY got sold. Same mechanic explains why gold flew.
The dollar cycle context is important here. The DXY explainer lays out why the 100 round level matters as a psychological floor. We are hovering just above it. If payrolls next month confirm the deceleration and CPI comes in soft, that 100.00 handle is the level the desk is watching because a clean break below flips the DXY structure from “consolidating” to “trending lower”. Every asset in the risk complex is priced off that level in one way or another, from EM debt to gold to non-USD earnings translation for the S&P 500’s international revenue base.
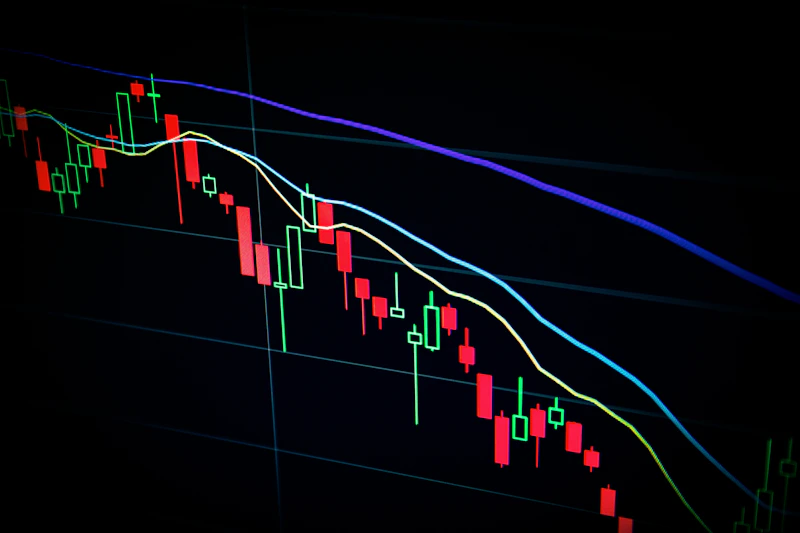
S&P 500 closed flat while the Dow ripped to a record and the Nasdaq cracked. Rotation, not risk-off.
Meta, Tesla and the AI spend problem
Two internal-communications headlines from Financial Juice landed inside the last two hours of trading and they matter more than they look on first read. Zuckerberg’s town hall admission that Meta’s stock price “would be higher without” the AI capex programme is the CEO of one of the four hyperscalers publicly saying that the market is not rewarding the spend. He framed it as a long-term investment, which is the right corporate line, but the message beneath it is that even the people running the spend acknowledge the equity holders are not being compensated for it in real time.
The Tesla headline is smaller but the same theme. Capping employee AI tool spend at $200 a week is a discipline signal, not a cost-cutting story. It says the CFO is watching the line item. When both Meta and Tesla give the market the same read in the same afternoon, that is enough for the Nasdaq 100 tape to pivot. The mega-cap AI trade has been the single most consensus long of the year. It does not take much of a narrative crack to see 1.6% come out on a session.
The MACRO MASTERY desk has been flagging the AI capex/free-cash-flow divergence for months. Same stack a hedge-fund analyst runs every morning, delivered daily. The framework says when hyperscaler capex growth accelerates past revenue growth for three consecutive quarters, the equity discount rate re-rates. We are in quarter three of that setup as of the last earnings cycle.
Gold and silver ripping alongside the rotation
Gold closed the session at $4,133.7 per ounce, up 1.61%, according to Yahoo Finance’s 20:00 GMT print. Silver was even sharper, +2.06% to $61.32. Both moves are the direct precious-metals expression of the payrolls miss. Real yields dropped, the dollar sold off, and the two things gold cares about most both moved in the metal’s favour on the same tape.
The desk’s cross-asset sentiment engine flagged the gold composite at +19.1 on the day, which is a strong bullish read against the DXY and yield drag. That composite score has held above 15 for the last six sessions. The World Gold Council price data shows the metal now printing multi-week highs, and the rate-cut re-pricing story is the clean explanation for why. A softer Fed path means a lower opportunity cost of holding a non-yielding asset. Simple, and the tape is respecting it.
The read across into equities is important. Gold ripping while the Dow prints a record does not typically happen in the same session unless the driver is a “financial conditions ease” print, which is exactly what payrolls delivered today. This is not defensive gold buying. This is monetary gold buying. The Dow’s cyclical bid and gold’s monetary bid are two expressions of the same underlying trade.
ASIC regulated. The desk’s preferred broker for retail macro traders who want the MACRO MASTERY desk overlay alongside the platform.
Breadth, sectors and the S&P 500 internals
You cannot read the S&P 500 close today from the headline number alone. The index printed 7483.24 for a 0.00% session, but the internals were anything but quiet. Because the S&P 500 is a market-cap-weighted index, the underperformance of the AI hyperscaler complex, which sits at roughly a third of the index by weight, dragged the top line while the equal-weighted version of the same index likely printed a strong positive session on the cyclical and value bid. This is the divergence signal that matters.
When you see the Dow at record highs, small-caps typically rally on the same rate-cut re-pricing, and financials, industrials, healthcare, and consumer discretionary all doing well simultaneously, that is what a broadening-out looks like in real time. It is the exact opposite of the concentrated leadership tape that has dominated the last twelve months. Whether it holds is a separate question, but the print today is a rotation regime signal.
Sector-level context from the wire flow: financials would have got a lift from the softer dollar and steeper curve implication, industrials from the cyclical bid, healthcare from being a bond-proxy alternative, and small-caps from the Russell’s high sensitivity to short-end rates. The AI-linked sub-sectors, semis, mega-cap software, hyperscalers, were the source of the Nasdaq drag. That maps almost perfectly onto the Dow-vs-Nasdaq dispersion the desk is calling out.
Cross-asset impact dashboard
Sold ↓
- ↓ NDX 29329.21 (-1.61%), mega-cap AI names
- ↓ DXY 100.884 (-0.50%), broad dollar slide
- ↓ USD/JPY 161.101 (-0.94%), yield transmission
- ↓ USD/CHF 0.8034 (-0.66%), safe-haven CHF bid
- ↓ VIX 16.2 (-2.35%), vol regime low
- ↓ WTI 68.48 (-0.15%), flat, growth uncertainty
Bid ↑
- ↑ DJI 52900.07 (+1.14%), record close
- ↑ XAU/USD $4,133.7 (+1.61%), rate-cut bid
- ↑ XAG/USD $61.32 (+2.06%), silver outperforming
- ↑ GBP/USD 1.3347 (+0.73%), cable standout
- ↑ BTC $61,463.98 (+2.45%), risk-on crypto bid
- ↑ ETH $1,698.58 (+5.59%), ETH outperformance
Asset-by-asset table: what the S&P 500 tape is pricing
| Asset | Close | What is priced |
|---|---|---|
| S&P 500 | 7483.24 (0.00%) | Headline flat masks aggressive sector rotation, cyclicals bid, mega-cap AI sold. |
| Dow Jones | 52900.07 (+1.14%) | Fresh record close, price-weighted cyclical basket wins the rate re-pricing. |
| Nasdaq 100 | 29329.21 (-1.61%) | AI capex narrative under pressure after Meta and Tesla headlines, hyperscaler distribution. |
| DXY | 100.884 (-0.50%) | Payroll miss cuts the yield differential, dollar re-rates lower into the 100 round. |
| Gold | $4,133.7 (+1.61%) | Monetary bid on lower real yields, not defensive flow. |
| VIX | 16.2 (-2.35%) | Vol regime low, the tape does not read this as fear, it reads it as regime shift. |
Scenario map into next week
Three scenarios weight into next week’s tape. These are not trade recipes. They are structural maps of where price tends to move and the levels that matter in each case.
Scenario 1 · Rotation continues (weight 45%)
Payrolls confirmed a labour-market deceleration that gives the Fed cover to cut. If next week’s ISM services print soft and CPI comes in on the screws or lower, the rotation deepens. In this scenario, the Dow tends to drift toward the round 53000 level as the next liquidity magnet above the 52900.07 record close, while the Nasdaq 100 stays under distribution as capital continues to rotate away from mega-cap AI. The S&P 500 in this scenario looks flat-to-slightly-up at the index level but with strong internals. Watch the 7500 round on SPX as the first psychological handle above the 7483.24 close.
Scenario 2 · Rotation stalls, mean-reversion tape (weight 35%)
An in-line CPI print or a hawkish Fed speaker (Powell or a voter walking back the payrolls read) stalls the rotation. In this scenario, the Nasdaq 100 tends to bounce back toward the 30000 round resistance as dip buyers step in on the AI complex, while the Dow consolidates below the 53000 round. The S&P 500 stays range-bound with the 7483.24 close acting as a magnet. Watch the 100.00 handle on DXY as the level that flips the whole cross-asset tape. If DXY holds 100.00, the rotation-stalls case gets the higher probability.
Scenario 3 · Growth scare escalates (weight 20%)
Payrolls turn out to be the first data point in a series, not an outlier. ISM services misses hard, jobless claims tick higher, and the tape re-reads the labour softness as recessionary rather than benign. In this scenario, the Dow’s cyclical bid unwinds fast as the earnings implication becomes the dominant driver, gold accelerates through prior weekly highs, and the S&P 500 breaks below 7400 round support. VIX would need to break above 20 to confirm this regime shift. Watch the 7400 round on SPX and the $4,150 round on gold as the levels that switch this scenario from tail-risk to base case.
ASIC regulated. Raw-spread ECN execution. Built for active intraday forex and index traders who care about cost per round-turn.
Key levels worth watching
Named levels only, taxonomy-clean
- S&P 500 · 7483.24, 2026-07-02 closing print, first magnet for tomorrow’s tape.
- S&P 500 · 7500 round, first psychological resistance above the close, natural liquidity anchor.
- S&P 500 · 7400 round, first psychological support, would need a break to confirm scenario 3.
- Dow Jones · 52900.07, 2026-07-02 record close, the level that has to hold to keep the rotation intact.
- Dow Jones · 53000 round, next liquidity magnet above the record close.
- Nasdaq 100 · 30000 round, first round resistance above the 29329.21 close, the level dip buyers tend to defend from.
- Nasdaq 100 · 29000 round, first round support below the close, break here confirms distribution.
- DXY · 100.00 round, the psychological floor for the whole dollar cycle, the level that decides the cross-asset tape.
- Gold · $4,150 round, next round above the $4,133.7 close, the level that flips gold from consolidation to trending.
- VIX · 20 handle, the vol regime switch level, break above confirms scenario 3.
The desk is calling this live inside MACRO MASTERY
Live NFP coverage as the print landed, the rotation call within minutes, the sector map by close. The MACRO MASTERY desk runs the full institutional read every session.
What is next: catalysts into the next session
The tape is set up for a follow-through session. Here is what the desk is watching into the Asia and Europe opens and through to Monday’s US cash session.
Scheduled catalysts
- Asia · 03 July 2026 China services PMI (June) is the top-tier print on the Asia calendar, per ForexLive’s event preview. A soft read reinforces the global growth-deceleration narrative and would extend the gold bid; a strong read partially offsets the payrolls story and could put a floor under the dollar.
- US · next week The ISM services print and CPI release are the two catalysts that decide whether the rotation extends or stalls. In-line CPI keeps the July FOMC cut in play; a hot CPI flips the whole scenario map.
- Fed speakers Any voter walking back the payrolls read on the wires is a directional catalyst for the dollar and the Nasdaq. The desk is watching the tone specifically on the “single data point vs trend” framing.
- Friday FX Options Expiries Flagged on Financial Juice at 19:22 GMT. These expiries can pin certain levels intraday, particularly on the EUR/USD 1.14 handle and USD/JPY 161.00 round.
Levels the desk is watching into the next session
- The S&P 500 close at 7483.24 as the pivot for tomorrow’s cash open. Hold above and rotation extends; give it back and the tape is consolidating.
- The Dow at 52900.07 as the level that must hold to keep the record intact.
- The Nasdaq 100 at 29000 round as the first structural support below the close.
- DXY 100.00 round as the cross-asset lynchpin.
- Gold at the $4,150 round as the next magnet.
The MACRO MASTERY desk covers each of these catalysts live as they land. FOMC, NFP, CPI live coverage as the prints hit the wire. Weekly performance scorecard, every win and every loss.
What would invalidate this view
Signals that force a reassessment
The rotation-tape read is contingent on the payrolls miss being confirmed as a trend rather than a single-print outlier. The following developments would force a reassessment:
- A hot CPI print next week (headline above consensus by 0.2% or more) that re-prices the July FOMC cut back out of the OIS strip.
- A hawkish walk-back from a Fed voter framing the payrolls miss as “noise” or “single data point” language.
- Nasdaq 100 recovering above the 30000 round on a session close, which would flip the AI distribution narrative back to accumulation.
- DXY reclaiming the 101.50 level, which would break the dollar-slide setup and pressure the gold and cyclical bid.
- A tape-wide risk-off event (VIX above 20, credit spreads widening, USD/JPY reversing) that turns the labour softness into a growth-scare read.
If any two of these fire together, the base-case rotation view has to be re-priced. The desk does not marry a read.
Final takeaway
The S&P 500 closed flat because the tape underneath it did the real work.
The Dow’s record and the Nasdaq’s crack in the same session is a textbook capital rotation print, catalysed by a soft-but-not-recessionary payrolls read that eased the Fed path and rewarded the assets that had been suppressed by the mega-cap AI concentration. The dollar slid, gold ripped, yields came in, and the domestic-cyclical basket won the day. Whether it extends depends on next week’s CPI and the Fed speakers’ framing. For now, the market is voting with its feet, and the vote is “cheaper money, broader participation, less AI concentration”.
In short
S&P 500 closed at 7483.24, unchanged, hiding one of the sharpest sector rotations of the year. Dow ripped to 52900.07 record on the rate-cut re-pricing, Nasdaq cracked 1.61% to 29329.21 on AI capex fatigue. Payrolls miss, dollar slide, gold ripping, VIX bleeding. Rotation, not risk-off.
Educational analysis only. Past performance does not guarantee future results. Manage risk against your own portfolio.
ASIC and FSCA regulation. Cent-account option for small balances. Leverage up to 1:1000 on the offshore entity for the high-leverage archetype.
Join MACRO MASTERY
The institutional macro intelligence desk. The exact stack a hedge-fund analyst runs every morning, delivered into a Discord community of serious traders.
07:00 London daily macro pulse. Live trade ideas with entry, target, stop, invalidation. FOMC, NFP, CPI live coverage as the prints land. BTC whale-flow signals. G7 central-bank rate pricing. Weekly performance scorecard, every win AND loss.
Free for life through our Blueberry Markets partnership (ASIC regulated). Members trade through Blueberry, get the entire desk in return. Funds stay with the broker in your name, withdrawable any time. Pure alignment, not a subscription.
Welcome DM lands instantly. Non-US residents only for now, US partner Q3.
Related reading
- Interest Rates: The Master Macro Driver Explained
- Risk On, Risk Off: The Framework Explained
- The US Dollar and DXY: Why It Moves Everything
- Federal Reserve monetary policy statements
- BLS Employment Situation reports
FAQ
Why did the S&P 500 close flat when the Dow hit a record?
The S&P 500 is market-cap-weighted, meaning roughly a third of the index is exposed to mega-cap AI and technology names that sold off on the day (Nasdaq 100 was down 1.61%). The Dow is a price-weighted basket of 30 industrial and financial names with very little AI hyperscaler exposure, so it captured the full benefit of the rate-cut re-pricing that followed the payrolls miss. Same macro tailwind, two very different equity outcomes based on sector composition. The S&P 500 headline of 7483.24 flat hides an aggressive rotation underneath.
What did non-farm payrolls actually print on 2 July 2026?
Non-farm payrolls printed 114K headline, matching consensus at 114K but well below the 172K prior read (ForexFactory). Average hourly earnings came in at 0.3% month-on-month against 0.3% forecast. Unemployment held at 4.3%, in line. The read is a soft-but-not-recessionary print. The labour market is loosening at the pace the Fed’s own projections said it should, giving the FOMC cover to cut rates at the next meeting. The market re-priced the July FOMC path from a coin-flip to a live cut in the OIS strip.
Is this a risk-off tape or a risk-on tape?
Neither, and that is the point. VIX closed at 16.2, down 2.35% on the day, so vol is not signalling fear. The Dow at record highs, gold ripping, and the Nasdaq cracking is a rotation tape, not a directional risk-off. It is a specific expression of capital moving from concentrated AI leadership into broader cyclical and value participation, catalysed by the softer payrolls print and the ensuing rate-cut re-pricing. The desk reads this as a regime pivot signal, not a panic signal.
What is driving the Meta and Tesla headlines and why do they matter?
Zuckerberg told an internal Meta town hall that the company’s AI capex programme “puts strain on the company” and the stock would be higher without it, framing it as a long-term investment (Financial Juice wire, 19:55 GMT). Separately, The Information reported Tesla is capping employee AI tool spend at $200 a week (19:15 GMT). Both headlines land in the same afternoon and both point to the same thing: the AI capex arms race is starting to show up as a P&L cost that even the CEOs running it acknowledge is not being rewarded by the equity market. That was enough narrative crack for the Nasdaq 100 to lose 1.61% on the session.
Why did gold rip 1.61% on the same day?
Gold cares about two things above all: real yields and the dollar. Both moved in gold’s favour today. The payrolls miss re-priced the Fed path lower, so US real yields dropped. The dollar sold off 0.50% on DXY to 100.884. Gold closed at $4,133.7, up 1.61%, and silver was even sharper at $61.32, up 2.06%. This is monetary gold buying, driven by lower opportunity cost of holding a non-yielding asset, not defensive gold buying. That distinction matters because monetary gold typically extends when the rate-cut narrative extends.
What are the key levels to watch on the S&P 500 into next week?
The 2026-07-02 closing print of 7483.24 is the first pivot. The 7500 round above is the first psychological resistance and the natural liquidity magnet. The 7400 round below is the first psychological support and would need to break to confirm a scenario 3 growth-scare re-pricing. On the Dow, the 52900.07 record close is the level that has to hold to keep the rotation intact, with the 53000 round as the next magnet above. On the Nasdaq 100, the 30000 round is the resistance dip buyers tend to defend from and the 29000 round is the first structural support below the close.
Is the AI trade over?
The tape today is a distribution session in mega-cap AI names, not a confirmed regime change. The Nasdaq 100 losing 1.61% on a day where the CEO of a top-four hyperscaler publicly says the equity market is not rewarding the spend is a signal, not a conclusion. The read will be confirmed or invalidated by the next hyperscaler earnings cycle and the CPI print next week. If free cash flow growth continues to lag capex growth for a fourth consecutive quarter and CPI confirms the rate-cut path, the AI concentration re-rate has legs. If either signal breaks, dip buyers step back in on the 30000 round.
What does the payrolls miss mean for the Fed’s July meeting?
The July FOMC has moved from a coin-flip to a live cut in the OIS strip on today’s payrolls print. That is the single biggest macro consequence of the day and it is why the dollar slid, gold ripped, and cyclicals bid. The confirmation catalyst is next week’s CPI. An in-line or soft CPI print keeps the cut in play and extends the rotation tape. A hot CPI print flips the whole map. The desk is watching Fed voter framing on the wires between now and then, specifically whether any FOMC member walks back the payrolls read as “noise” or “single data point” language.
How should I read the DXY at 100.884 in the context of this tape?
DXY at 100.884 is sitting just above the 100.00 round, which is the psychological floor for the whole dollar cycle. The DXY explainer covers this in depth. If next week’s data confirms the labour deceleration and CPI comes in soft, a clean break below 100.00 would flip the DXY structure from consolidating to trending lower, and every asset in the risk complex gets a further tailwind. If DXY holds 100.00 and reclaims 101.50, the dollar-slide setup breaks and the gold and cyclical bid come under pressure. It is the single most important cross-asset level on the board.
Where does the Macro Mastery desk fit into all this?
The MACRO MASTERY desk is the institutional macro intelligence platform where the desk delivers the daily read live. NFP was covered live as the print landed today, the rotation call was on the tape within minutes, and the sector-by-sector map was distributed by close. The desk runs the full stack a hedge fund analyst uses every morning, into a Discord community of serious traders. Free for life through the Blueberry Markets partnership. Members trade through Blueberry and get the entire desk in return.
Sources: Yahoo Finance (equity indices, FX, commodities, VIX, snapshot 2026-07-02 20:10 GMT); ForexFactory (economic calendar for US payrolls, average hourly earnings, unemployment rate); ForexLive (Americas market news wrap, US dollar slides as non-farm payrolls miss, 20:04 GMT; Asia event calendar 03 July 2026); Kobeissi Letter (Dow record close wire, 20:05 G
From the desk, free
Get the macro framework the desk actually trades
The same regime-first framework behind every call on this site. Free. No spam, unsubscribe anytime.
Trading this with real money?
The desk routes traders to the broker that fits their style, not to whoever pays most. Find your route in under a minute.
Continue reading
From the desk
Where this gets traded
Reading the macro driver is half of it. The other half is an account that holds execution when the driver actually moves the tape. See the KenMacro desk guide to the best brokers for macro traders.
Read the desk guide →