
The Fed Hiked. Japan Hiked. Why Did the Yen Fall, and What Does It Mean for Gold and Oil?
The Federal Reserve raised rates by 25 basis points to 3.75% to 4.00% on 16 September. Two days later the Bank of Japan lifted its policy rate to 1.25%, the highest in 31 years. The yen still weakened. That is not a contradiction once you stop reading the decision and start reading the reaction, because currencies, yields and gold trade the gap between what was expected and what the decision changes about the path ahead.
So the headline was two hikes. The information was in what the market did next, and that is what this episode of Inside The Read is about.
Stop starting with the candle.
What actually happened this week?
Here is the sequence, with what is confirmed kept separate from what is interpretation. The decisions are facts. What they mean for the dollar, the yen or gold is a reading of how markets responded, and that reading can change as more information comes in.
| When | What is confirmed | Why it matters |
|---|---|---|
| Wed 16 September | The FOMC raised the target range by 25bp to 3.75% to 4.00%, by a unanimous 12-0 vote. The first Fed hike since July 2023. | The action is confirmed. Any claim that the dollar must now rally is interpretation, not part of the decision. |
| Fri 18 September | The BOJ raised its policy rate by 25bp to 1.25% from 1.00%, in a 7-2 vote. Both dissenters wanted no hike. | A hike and a weaker yen can coexist when the hike was priced and the guidance did not surprise. Both dissenters wanted to hold. |
| Fri 18 September, after the BOJ | USD/JPY rose from about 156.3 to above 157 and traded near 158 by mid morning in London, then closed at 156.76. Spot gold rose about 1% to $4,382.59. Brent settled nearly 1% lower at $103.87 as fears of lasting supply damage eased. | Different markets were processing different parts of the week. |
| Mon 21 September | USD/JPY back near 157.5 by the evening in London, and gold softer, around $4,340 to $4,370, on a firmer dollar. Brent fell more than 3% to around $100.4 by mid afternoon in London and briefly traded below $100. | Monday is a separate snapshot. It is not a continuation of Friday by default. |
Levels are vendor quotes in London time and are rounded. Sources are listed at the end of the article.
The Fed hiked. Why does the 2-year Treasury yield matter?
A central bank decision is a snapshot. The 2-year Treasury yield is one of the best live reads of how the market’s view of the next stretch of US policy has changed. It is not a perfect forecast of the Fed and it can move for other reasons, but it responds most directly to monetary policy repricing.
On the day of the decision the 2-year closed at 4.74%, up 7 basis points from 4.67% the day before, on the US Treasury’s daily par yield curve. The 10-year barely moved, from 5.00% to 5.01%. The front end repriced policy and the long end was already somewhere else, which is exactly why you never treat the two as the same trade.
The 10-year carries expected short rates over a decade, plus inflation risk, government borrowing and the term premium investors demand for lending that long. By Friday both were back up, the 2-year at 4.76% and the 10-year at 5.01%. So the market did not read the hike as the end of the story. It kept the door open to more.
The desk question: did the Fed change the expected path, or did it simply deliver what traders had already prepared for?
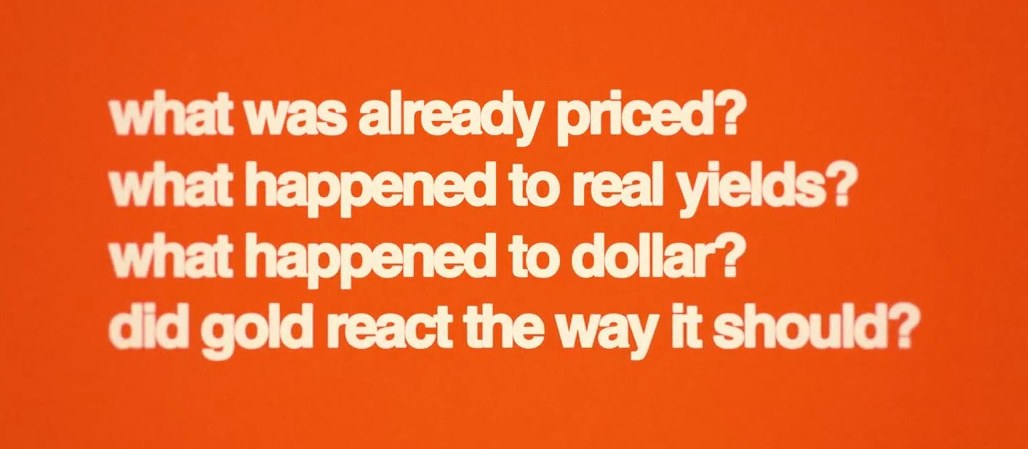
Why can gold rise after a Fed hike, and then fall the next session?
Gold pays no interest, so what you can earn elsewhere matters. But the word yield on its own is not enough. You need the dollar, inflation expectations and the real yield, which is the yield left after expected inflation. The US 10-year real yield on the Treasury’s TIPS curve was 2.68% on Fed day and 2.68% again on Friday, which is a heavy headwind for a metal that pays nothing.
And yet gold went from about $4,264 at Wednesday’s London close to around $4,380 on Friday, while the real yield was still 2.68%, above the 2.62% it closed at the day before the Fed, and the 2-year had edged up to 4.76%. That is the textbook refusing to behave. On Monday gold slipped back to around $4,340 to $4,370 as the dollar firmed, so Friday’s move was not the start of a clean trend either. Reuters reported spot gold down 0.1% at $4,371.95 at midday London time, with a slightly firmer dollar adding to the pressure.
When gold rises against higher real yields, something else is doing the lifting. It can be haven demand, it can be positioning, and it can be buyers who are not rate sensitive at all. The mistake is deciding which one before you have checked.
Want the process, not another rule to memorise?
Japan raised rates. Why did USD/JPY rise?
This was the cleanest contradiction of the week. The Bank of Japan raised its policy rate to 1.25% on 18 September, its highest in 31 years, in a 7-2 vote, and the yen still weakened against the dollar after the announcement. USD/JPY was around 156.3 before the decision and above 157 within two hours, according to vendor quotes in London time. By Friday’s close the yen was 0.5% weaker at 156.76 per dollar, according to Reuters.
Look at who voted against. Both dissenters, Toichiro Asada and Ayano Sato, wanted to keep rates unchanged, according to the Bank of Japan’s own statement. Reuters reported that the two dissents and a lack of explicitly hawkish guidance left investors reluctant to buy the yen.
The way to understand it is straightforward. If traders already expected a Japanese hike, it is in the price before the announcement. The new information is how quickly Japan might move again, and how that compares with the Fed, which had just hiked and kept its own door open. A currency is a relative rate trade as well as a capital flow and risk trade, so you cannot read the BOJ in isolation.
There is also a policy wall in this pair. Japan’s Ministry of Finance spent a record ¥15.4 trillion defending the yen between 30 July and 26 August, and the market knows that level of intervention risk exists above current prices. I covered that in detail in the yen intervention and carry trade read, and the mechanics are in the currency intervention explainer.
The desk question: did the rate gap narrow by more than traders expected, did Japanese yields and USD/JPY agree, and what would make you abandon the first reaction?
Oil is the bridge back to inflation
The oil story started with Saudi Arabia’s East-West pipeline, which carries crude across the kingdom to Yanbu on the Red Sea, the route that lets Saudi barrels avoid the Strait of Hormuz. Saudi Arabia shut it as a precaution after a drone attack on 11 September that it blamed on Iran-backed militias launching from Iraq. Iraq said the drones were launched from its Maysan province, and no group formally claimed the attack. Regional officials told the Associated Press that repairs could take three to five weeks.
Then the headlines got louder while the price went the other way. Yemen’s Houthis claimed attacks on Riyadh and an Aramco facility in Yanbu around 20 September. Those are claims, and the damage has not been independently verified. Yet Brent, which settled at $103.87 on Friday, fell more than 3% on Monday and briefly traded below $100, because the physical picture was improving. Reuters reported Saudi Arabia ramping up exports through its Gulf terminals, with satellite and shipping data showing more supertankers loading there.
That does not mean the supply problem is over. Only about a dozen commodity vessels transited the Strait of Hormuz over the weekend, down from 35 the weekend before, according to Reuters shipping data. More barrels leaving from the Gulf and fewer ships getting through Hormuz are competing facts to monitor, not a reason to declare either side the winner.
Why does the Fed care? Expensive energy raises transport and production costs, and some of that can pass into consumer prices, which is what August’s CPI and PPI were already showing through gasoline, diesel and airline fares. Weaker demand or restored supply can pull the other way. A central bank can influence demand through borrowing costs, but it cannot repair a pipeline, and that tension is why the inflation outlook depends on both.
The desk question: is Brent responding to a real change in available barrels, or to fear that supply might change?
The cross-asset decision tree for the sessions ahead
These are conditional research scenarios, not predictions or trading signals. Check the current chart and the timestamp before you apply any branch.
| What you see | A possible reading | What needs checking |
|---|---|---|
| US 2-year rises, dollar rises, gold softens | The policy rate channel is in control | Was it already priced? Do real yields confirm? |
| US 2-year rises, dollar stalls | Something is offsetting the rate advantage | Positioning, overseas rates, risk appetite |
| USD/JPY rises after BOJ tightening | The US and Japan rate path, or positioning, outweighs the headline | The actual rate gap, BOJ guidance, JGB yields, intervention risk |
| Oil falls despite new attack headlines | Traders are pricing alternative routes or a smaller physical loss | Export volumes, pipeline repairs, tanker flows |
| Gold rises while the dollar and real yields rise | Rate sensitivity is competing with another source of demand | Haven flows, liquidity, positioning, whether it holds |
The order I use never changes. Identify the event, write down what was priced beforehand, read what actually changed, then watch the 2-year and the longer yields, then FX, and only then ask whether gold or oil is confirming. If the chart refuses the obvious interpretation, do not force it. That is the same process I set out in the free KenMacro macro framework.
A macro view is not a marriage. It is a decision tree.
Keep this read beside your desk
The episode gives you the story. The Episode 4 Companion Desk Note gives you the checklist, the cross-asset decision tree and a printable worksheet to write your own confirmation and invalidation levels before the next release. It sits with the rest of the series in the Inside The Read archive, where Episodes 1 to 3 and their desk notes are free as well.
Work through this week’s read with me, live.
Frequently asked questions
Did the Fed raise interest rates in September 2026?
Yes. On 16 September 2026 the Federal Reserve raised the federal funds target range by 25 basis points to 3.75% to 4.00%, its first increase since July 2023. The next scheduled decision is on 28 October 2026.
What did the Bank of Japan decide on 18 September 2026?
The Bank of Japan raised its short term policy rate by 25 basis points from 1.00% to 1.25%, the highest in 31 years, in a 7-2 vote. Both dissenting members, Toichiro Asada and Ayano Sato, preferred to leave rates unchanged. The new rate takes effect on 24 September 2026.
Why did the yen weaken after the BOJ rate hike?
The hike was widely expected, so it was largely priced before the announcement. The exchange rate responded to what the decision implied about the pace of future Japanese hikes relative to the Fed, and USD/JPY rose from about 156.3 to above 157 within two hours of the decision.
Why did gold rise after the Fed hiked?
Gold recovered to around $4,380 by Friday 18 September even though the 2-year yield and the 10-year real yield were higher than before the decision. That points to demand that is not driven by rates, such as haven buying or positioning. Gold softened again on Monday 21 September as the dollar firmed.
What is a real yield?
A real yield is the return on a bond after expected inflation. In the US it is read from Treasury inflation protected securities. The 10-year real yield was 2.68% on 16 and 18 September 2026. Higher real yields usually weigh on gold because gold pays no interest, but the relationship is not mechanical.
How does oil affect the Fed?
Higher energy prices raise transport and production costs and can pass into consumer prices, which keeps pressure on the Fed. But a central bank cannot fix a supply disruption, so oil driven inflation makes policy harder rather than simply pushing rates higher.
When is the KenMacro live workshop?
The free live macro trading workshop is on Sunday 27 September 2026 at 7pm UK time. Registration is at kenmacro.com/workshop and the joining details are sent by email.
Ken Chigbo is the founder of KenMacro and presenter of Inside The Read, a weekly macro trading series on economic releases, central bank decisions, rates, currencies and commodities. About Ken.
Educational purposes only. Nothing in this article is personal investment advice, a trading signal or a guarantee of results. Trading leveraged products carries a high risk of losing money. The workshop, desk note and Blueprint are KenMacro products; the terms shown at checkout apply.
From the desk, free
Get the macro framework the desk actually trades
The same regime-first framework behind every call on this site. Free. No spam, unsubscribe anytime.
Continue reading
From the desk
Where this gets traded
If you trade gold (XAU/USD) around real-yield shifts, CPI or FOMC, execution quality decides the fill. See the KenMacro desk guide to the best brokers for trading gold.
Read the desk guide →Part of the Gold Forecast hub, the desk’s living guide, kept current as markets move.