Currency Intervention Explained: How It Works and What the US and Japan Just Did to the Yen
Currency intervention is a government buying or selling its own currency to change its price. Here is what you need to know, in five lines.
- In Japan the Ministry of Finance decides and the Bank of Japan executes as its agent. The BoJ does not choose to intervene. It is instructed.
- To strengthen the yen, Japan sells dollars out of its foreign reserves and buys yen. To weaken it, Japan issues short term Financing Bills, sells yen and buys foreign currency.
- On Thursday 30 July 2026 Japan acted alone. On Friday 31 July the US Treasury joined it, buying yen through the New York Fed. Both governments confirmed it over the weekend of 1 to 2 August.
- That was the first joint US and Japan operation to strengthen the yen since June 1998, and the first coordinated action of any kind between them since March 2011.
- USD/JPY fell from just under 164 to an intraday 155.20, about 3.8% across two sessions. History says that buys time rather than a trend change.
Most explanations of currency intervention stop at “the government stepped in”. That is not useful when you are the one holding the position. This piece covers what intervention actually is, who signs it off, what the mechanics look like on the day, what the historical record says about how far these moves go and how long they hold, and what happened in the last week of July 2026, which was the most significant currency operation between Washington and Tokyo in a generation.
What is currency intervention?
Currency intervention, or foreign exchange intervention, is a transaction in the open market by a government or its central bank with the deliberate aim of moving its own exchange rate. It is not monetary policy. Nobody changes an interest rate. It is a large, direct trade placed to alter a price.
Governments do it for one of two reasons. Either the currency is too strong and is damaging exporters, or it is too weak and is importing inflation. Japan has done both in living memory. It spent roughly 35 trillion yen between 2003 and 2004 trying to hold the yen down. Since September 2022 it has been doing the opposite.
The critical thing to understand is that officials almost never describe it as defending a level. They describe it as countering disorderly movements and excessive volatility. That is deliberate. A stated level is a target the market can attack. Speed, not price, is the official trigger, at least on paper.
Who decides, and who presses the button?
Japan
The Ministry of Finance holds the authority. The Bank of Japan acts as its agent and executes the orders. This distinction matters and is routinely reported wrongly. When you read “the BoJ intervened”, the decision was the MoF’s. The BoJ is the dealing desk.
Funding differs by direction. Buying yen means spending existing foreign currency reserves, which is finite and is the reason size matters. Selling yen means issuing Financing Bills, which is effectively unlimited, and is why fighting a strong yen is easier than defending a weak one. Japan is currently on the hard side of that asymmetry.
The United States
The Treasury has authority over US exchange rate policy and funds operations through the Exchange Stabilization Fund. The New York Fed executes as agent. So a US intervention is a Treasury decision, not a Federal Reserve monetary decision, which is why it can happen without any FOMC involvement at all.
Unilateral, coordinated, and verbal
- VerbalOfficials escalate their language deliberately, from “watching with a sense of urgency” to “will not rule out any options” to “ready to act decisively”. It is free, and it works until it does not. Markets have largely stopped paying for it.
- UnilateralOne country acting alone. Japan’s 2022, 2024 and April 2026 operations were all unilateral. Cheaper politically, but the market knows reserves are finite and will test them.
- CoordinatedTwo or more authorities acting together. Far rarer and far more potent, because it signals that the counterparty government is not going to lean against the move. This is what happened on 31 July 2026.
When they intervene, what are they actually doing?
On a yen buying operation the mechanics run roughly like this.
- The orderThe MoF instructs the BoJ to buy yen. The BoJ works the order through commercial banks rather than showing itself directly.
- The timingDeliberately chosen for thin liquidity, which maximises the price effect per unit spent. The Tokyo lunch break, the London fix, and the New York afternoon are all favoured windows. The 30 July operation was executed in New York hours.
- The pairsNot just USD/JPY. A large share goes through the crosses, which is why EUR/JPY and GBP/JPY can move violently and often further in percentage terms than the dollar pair itself.
- The fundingDollars come out of reserves. Historically that could mean selling US Treasuries, which pushes American yields up. In 2026 there is now another route, covered below.
- The confirmationUsually nothing at the time. Japan often refuses to confirm for weeks. Official monthly totals are published at month end, with the daily breakdown only quarterly.
What happened between 30 July and 1 August 2026
By late July the yen had fallen to a 40 year low, with USD/JPY trading just under 164. What followed came in two distinct parts, and most coverage has merged them into one.
- Thu 30 JulyJapan acted alone, in New York hours. Bank of Japan account data implied Tokyo may have sold as much as $58.97bn that day. Treat that as an estimate derived from BoJ data, not a disclosed figure. USD/JPY broke below 161 and EUR/JPY dropped roughly 400 pips in minutes.
- Fri 31 JulyThe US Treasury joined. The New York Fed bought yen on the Treasury’s behalf, funding the purchase by selling euros rather than dollars. A note photographed on Secretary Bessent’s pad at a Camp David cabinet meeting that day read “Buy Japanese Yen (JPY) $5-10 bil”.
- Sun 2 AugJapan’s Ministry of Finance confirmed the coordinated operation, and Secretary Bessent confirmed it publicly. Finance Minister Katayama said it “countered excessive volatility and disorderly movements”. Bessent said Treasury “will not hesitate to participate in further joint intervention”.
- The resultUSD/JPY fell to an intraday 155.20, a near three month low, having gained as much as 1.4% on the day and about 3.8% across the two sessions.
Why Washington actually helped
President Trump framed it simply, saying Japan “wanted a little bit of help. And we’re always there for Japan.” The mechanical explanation is more interesting, and it is about the US bond market rather than about Japan.
Japan holds an enormous pile of US Treasuries. If Tokyo has to fund a very large yen buying operation by selling those bonds outright, it pushes American long yields higher at exactly the moment the US can least afford it. The 30 year Treasury yield ended July around 5.24%, a 19 year high.
The route around that problem is the Federal Reserve’s FIMA repo facility, introduced in 2020. It lets foreign central banks temporarily pledge their Treasury holdings to the Fed and receive dollars, instead of selling the bonds. Bessent indicated the facility was used in Friday’s coordinated action and went further, saying it is “an important backstop” that should be “upsized in the coming months”. The facility has typically been capped near $60bn per institution, while foreign official institutions hold just under $3 trillion at the New York Fed, roughly $2.65 trillion of it in Treasuries.
Read that as what it is. Helping Japan defend the yen is also defending the US Treasury market from a forced seller. That is the strategic logic, and it is why this operation has a different character from a favour between allies.
The chart: intervention territory, and the sweep that preceded the strike
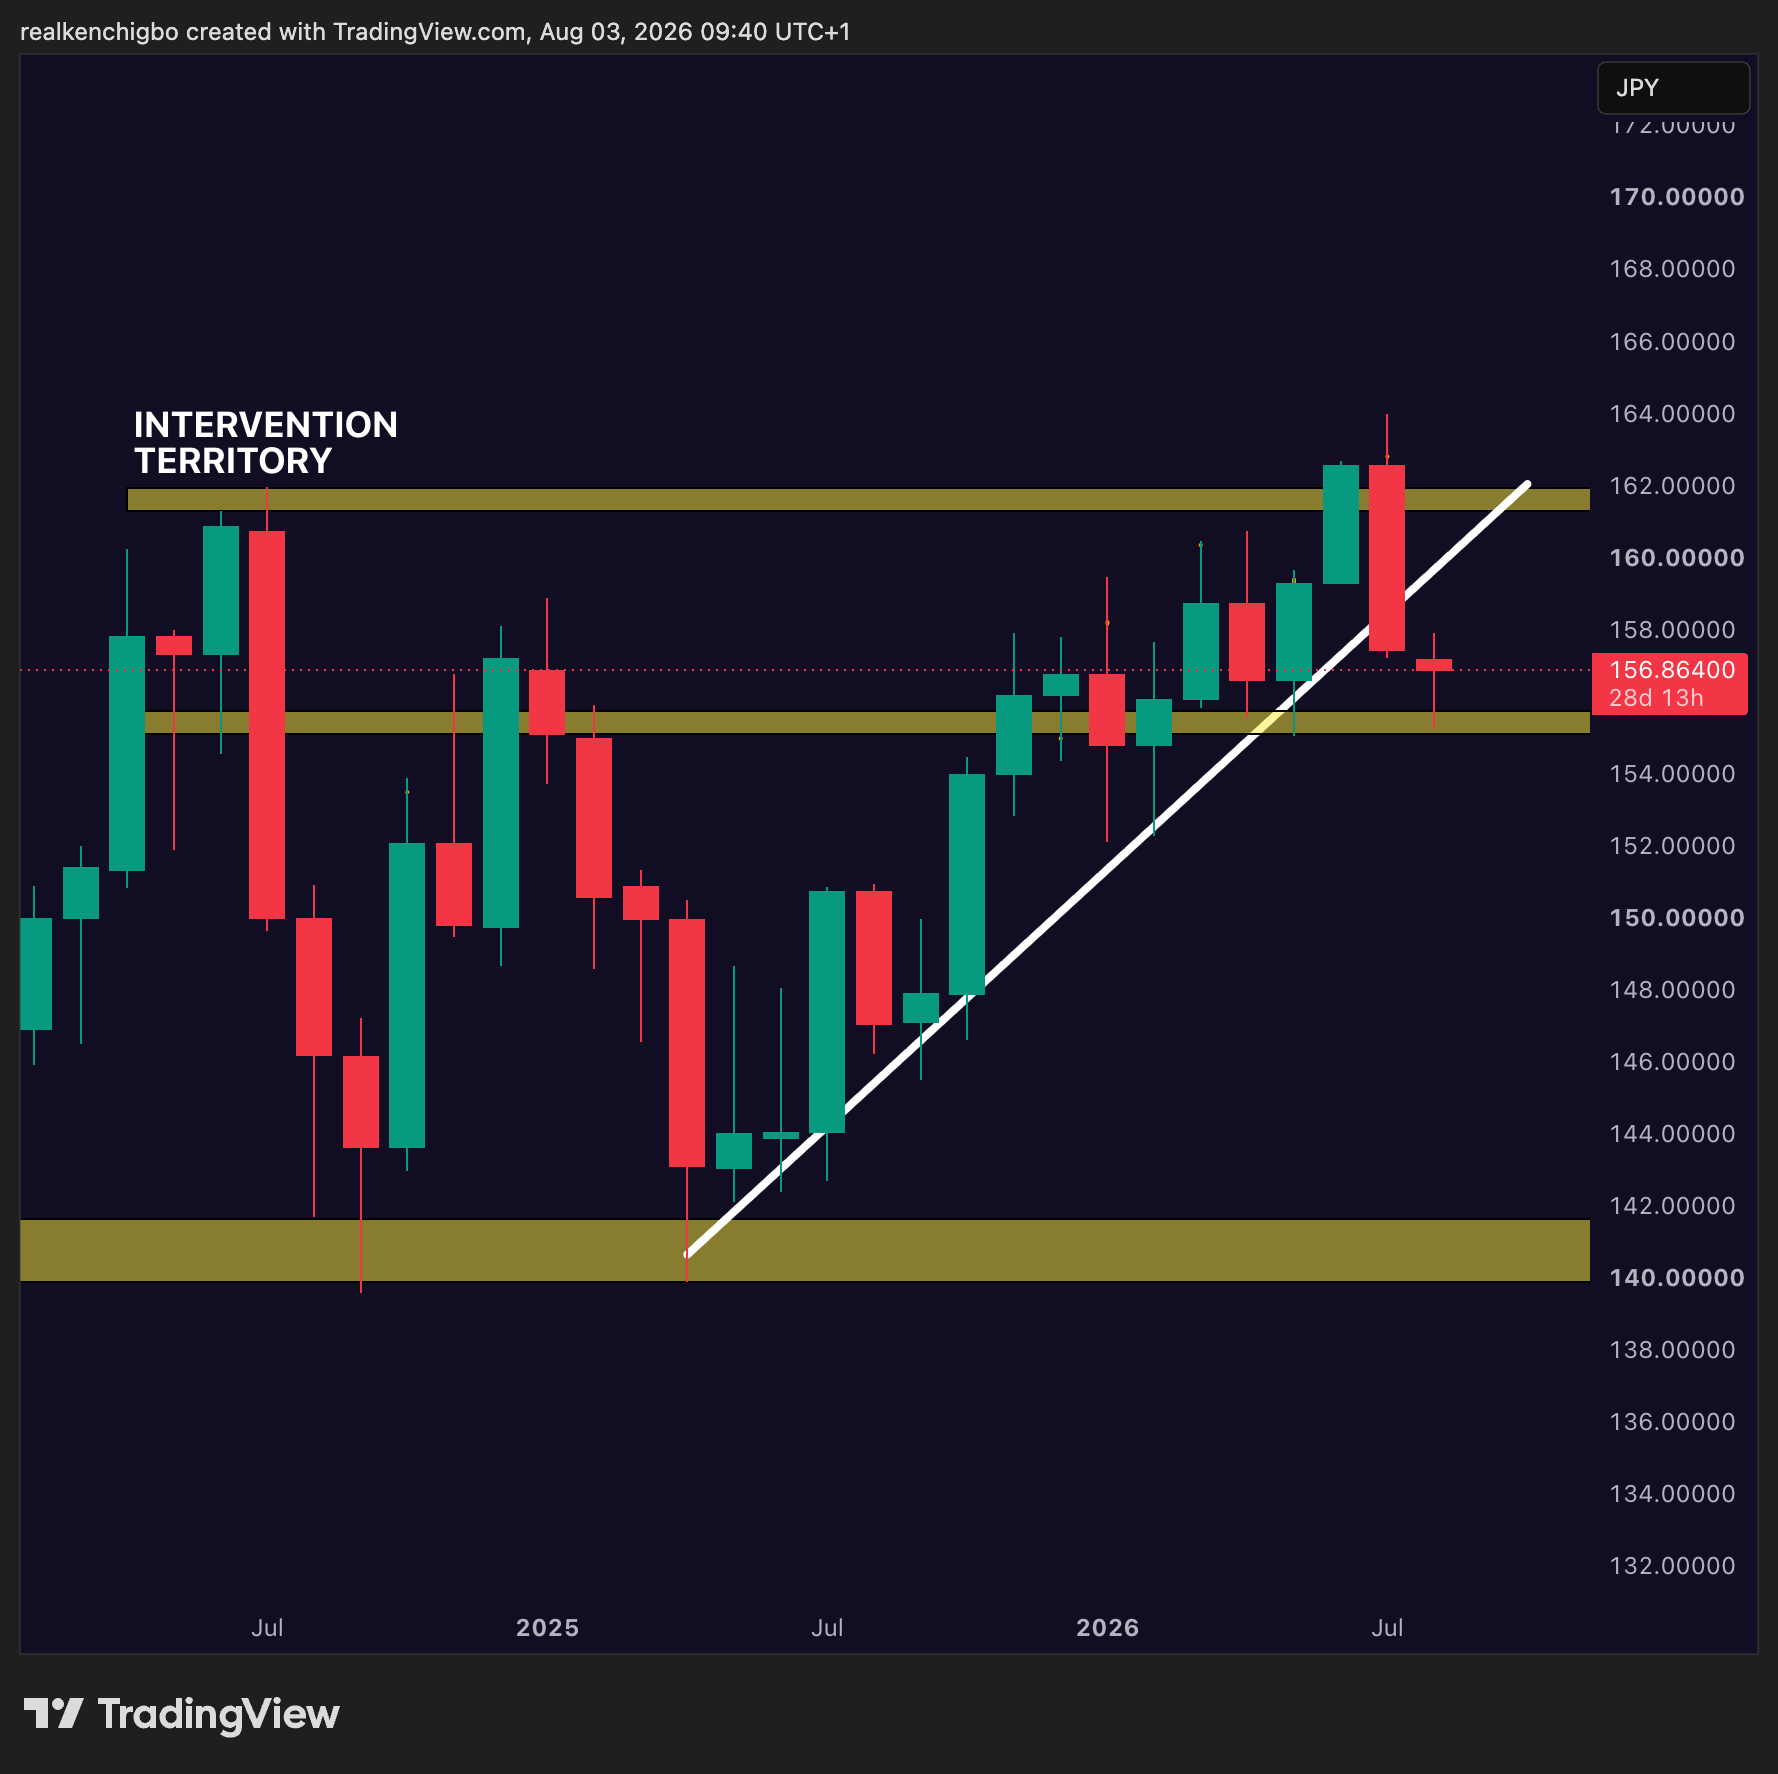
The monthly chart makes a point that the news coverage does not. The upper band, marked intervention territory, is the area around 161.76 to 161.95. That is where USD/JPY topped in early July 2024, and it is the level Japan defended on 11 and 12 July 2024.
For two years that zone capped the pair. In July 2026 price did not stall there. It traded clean through it and ran to just under 164, taking out every stop and resting order sitting above a two year high, and then the intervention arrived. The desk reads that as a liquidity sweep into the strike rather than a coincidence: the market ran the old high, found the size waiting above it, and reversed hard.
Whether Tokyo timed it that way or simply let the move exhaust itself first is unknowable from the outside. Either way the practical lesson is the same. Intervention zones are not walls. They are pools of liquidity, and price frequently trades through them before the response comes. Anyone who treated 161.95 as a hard ceiling was carried roughly 200 pips beyond it before being proved right.
The lower bands on the chart, around 155.3 to 156.0 and the larger shelf at 140 to 141.5, are where the desk expects the pair to look for support if the post intervention move extends. The white line is the ascending trend from the 2025 low, which price has now broken back below.
Every Japanese yen buying operation since 2022, and what happened next
These are the disclosed figures from Japan’s Ministry of Finance. They are the most useful dataset in this whole subject, because they tell you what size actually buys.
- 22 Sep 20222.84 trillion yen. The first yen buying operation since 1998. USD/JPY dropped roughly 5 yen, then made new highs within a month.
- 21-24 Oct 20226.35 trillion yen, about $42.8bn. The largest yen buying operation at that time. This one worked, but mostly because the BoJ’s yield curve control shift in December gave it a follow on catalyst.
- 26 Apr-29 May 20249.79 trillion yen, about $62.25bn. Included a then record single day of 5.92 trillion yen on 29 April and a further 3.87 trillion on 1 May.
- 11-12 Jul 20245.53 trillion yen, about $36.8bn. Took USD/JPY from 161.76 to 157.30. This is the operation that created the upper band on the chart above.
- 28 Apr-27 May 202611.73 trillion yen, about $73bn. A record, nearly double the largest prior effort. Despite that scale, the pair traded back above the intervention level within six weeks.
- 30-31 Jul 2026Size not yet disclosed. The MoF publishes monthly totals at month end and the daily breakdown quarterly, so the official number for this operation is still pending.
Add the disclosed figures and Japan has spent roughly 36 trillion yen on five yen buying campaigns since September 2022, before last week’s operation is even counted. The trend in the pair over that period has been higher throughout.
How long does an intervention actually last?
This is the question that matters most and the one that gets the vaguest answers. The record since 2022 is consistent enough to generalise.
- ImmediateThe first move is violent and fast. Two to five yen in minutes to hours is normal. The 2024 operation produced roughly 450 pips. Last week produced about 3.8% across two sessions.
- 1 to 3 monthsThe typical window over which the initial rally holds, and in every prior case it held only because a follow on catalyst arrived. In 2022 that was the BoJ’s yield curve control adjustment. In 2024 it was the carry trade unwind.
- The 2026 exceptionThe April to May 2026 operation was the largest in history and the pair was back above the intervention level in six weeks. Record size bought less time than smaller operations had previously.
- StructuralNone of the five reversed the trend. Intervention has never fixed the driver, which is the rate differential and, increasingly, inflation expectations.
The honest summary, and it is the one the desk uses: intervention buys time, not direction. It changes the speed of a move and the shape of the path. It does not change where the currency wants to go unless something else changes underneath it.
What would make this one different is the joint element. Every prior operation on that list was Japan acting alone. A standing commitment from the US Treasury to participate again is a genuinely new variable, and it is the reason to treat the 2026 episode with more respect than the base rate suggests.
What it does to the yen crosses
Traders watching only USD/JPY consistently underestimate this. A large share of intervention flow passes through the crosses, and the crosses frequently move further.
- EUR/JPYFell roughly 400 pips in minutes on 30 July and was down about 1.9% on the day. The US side of Friday’s operation was funded by selling euros, which adds a second, separate source of pressure on this specific cross.
- GBP/JPYDown about 1.8% on the day. Typically the most volatile of the majors into an intervention because of its wider spread and thinner depth.
- The asymmetryYen crosses fall faster than they rise. Positioning is usually long carry, so an intervention forces a crowded, leveraged, one directional exit.
How to tell a real intervention from a rumour
- Rate checksThe MoF calling banks for quotes without dealing. A deliberate warning shot and frequently reported. It is not intervention.
- The language ladderWatch for escalation from “closely watching” to “excessive and disorderly” to “ready to take decisive action”. The last phrasing has preceded most real operations.
- BoJ account dataThe hard tell. Compare the BoJ’s daily forecast of current account balances against the actual outturn. A large unexplained gap is the market’s best same day evidence, and it is where the $58.97bn estimate for 30 July came from.
- Official dataThe MoF’s monthly total is the confirmation. Everything before it is inference, however well sourced.
What the desk is watching now
- Follow throughWhether a catalyst arrives to extend this. Without one, the base rate says the pair grinds back. US payrolls and the next BoJ meeting are the candidates.
- The MoF figureThe month end disclosure covering 30 and 31 July. If it prints above the 5.92 trillion yen single day record, the commitment is larger than the market currently assumes.
- FIMAWhether the facility gets upsized. That would be the clearest signal that Washington expects to do this repeatedly.
- The differentialNothing structural changes until the US and Japan rate gap narrows. That is the actual driver and it is still wide.
Frequently asked questions
What is currency intervention in simple terms?
It is a government buying or selling its own currency in the open market to change its price. To strengthen a currency it spends foreign reserves buying it back. To weaken one it creates and sells its own currency. It is a direct trade, not an interest rate decision.
Did the US and Japan really intervene together in 2026?
Yes. Japan’s Ministry of Finance and US Treasury Secretary Scott Bessent both confirmed a coordinated yen buying operation carried out on Friday 31 July 2026, executed for the US by the New York Fed. Japan had already intervened alone the previous day.
When was the last joint US and Japan intervention?
To strengthen the yen, June 1998. There was a coordinated G7 operation in March 2011 that also involved both countries, but that one was designed to weaken the yen after the Tohoku earthquake, so it was the opposite trade.
How long does the effect of a yen intervention last?
Historically one to three months, and only when a follow on catalyst arrived to extend it. The record sized April to May 2026 operation saw USD/JPY back above the intervention level within six weeks. No intervention since 2022 has reversed the underlying trend.
How much has Japan spent intervening?
Roughly 36 trillion yen across five disclosed yen buying campaigns since September 2022, including a record 11.73 trillion yen between April and May 2026. The size of the July 2026 operation has not been disclosed yet.
Why did the US sell euros instead of dollars to buy yen?
Selling dollars to buy yen would have meant the US actively weakening its own currency. Selling euros achieves the yen purchase without the Treasury taking a direct position against the dollar, and it drew the pressure onto EUR/JPY instead.
Educational content only. This is not financial advice and not a recommendation to buy or sell any instrument. Levels and figures are as at 3 August 2026 and are sourced from Japan’s Ministry of Finance, the US Treasury, the Bank of Japan, Reuters, CNBC, Al Jazeera, Bloomberg and TradingEconomics. Market data changes; verify before acting. Trading carries risk and you can lose more than your deposit.
From the desk, free
Get the macro framework the desk actually trades
The same regime-first framework behind every call on this site. Free. No spam, unsubscribe anytime.
Trading USD pairs?
Platform, spreads and execution decide more than the call does. Check your broker route before opening an account.
Continue reading
From the desk
Where this gets traded
Reading the macro driver is half of it. The other half is an account that holds execution when the driver actually moves the tape. See the KenMacro desk guide to the best brokers for macro traders.
Read the desk guide →