Why Is The Dollar Rising After Warsh’s Hawkish FOMC 2026
The dollar isn’t rising on a whim. It’s rising because Kevin Warsh just told the market the easing cycle is dead.
If you were waiting for confirmation that the new Fed Chair would run a different playbook, you got it last night. The desk called this regime shift before the meeting. The dollar broke 100.00, EUR/USD broke 1.1500, GBP/USD rolled, gold flushed to 4,219 before stabilising. None of that was random. All of it was the mechanical consequence of one decision: stripping the easing bias, lifting the 2026 dot, and refusing to hand-hold the market with forward guidance.
This is the post-FOMC explainer, and it answers the question every screen in the City is staring at this morning: why is the dollar rising, and how long does this last?
By Ken Chigbo · Founder, KenMacro · 18+ years in markets, London trading floor and institutional FX
In one sentence: the dollar is rising because Warsh’s first FOMC repriced the Fed path from cuts to a possible 2026 hike, lifting real yields, widening the dollar’s carry advantage, and forcing a violent rotation out of gold and the major pairs into Treasuries and the greenback.
Quick Answer
- ☐ Fed held 3.50 to 3.75 percent unanimously (12 to 0), but stripped the easing bias from the statement.
- ☐ Median 2026 dot rose to ~3.8 percent from 3.4 percent in March, flipping the signal from cut bias to hike bias.
- ☐ DXY broke the 100.00 handle to 100.23, the higher low sits at 99.40 to 99.50.
- ☐ EUR/USD broke the 1.1500 floor to 1.1513, GBP/USD broke 1.3300 to 1.3296.
- ☐ Gold rejected at 4,345 to 4,350, flushed to 4,219, recovered above 4,300 on an interim US-Iran Strait of Hormuz deal.
- ☐ Equities heavy, Nasdaq leading the downside, US 2Y yield surged on the hike-bias dot plot.
- ☐ The single variable that matters now: every inflation, jobs and oil print, because Warsh removed the safety net.
Jump to section
- What Warsh actually did
- Why is the dollar rising, the mechanics
- The dot plot shift that broke the consensus
- Real yields, the dollar, and the gold flush
- Why EUR/USD and GBP/USD are falling
- What a hawkish Fed means for stocks
- The Hormuz wildcard cushioning gold
- What the desk said before the meeting
- Scenarios from here
- Key levels worth watching
- What would invalidate this view
What Warsh actually did at his first FOMC
Let’s start with the facts, because the rate decision and the message diverged.
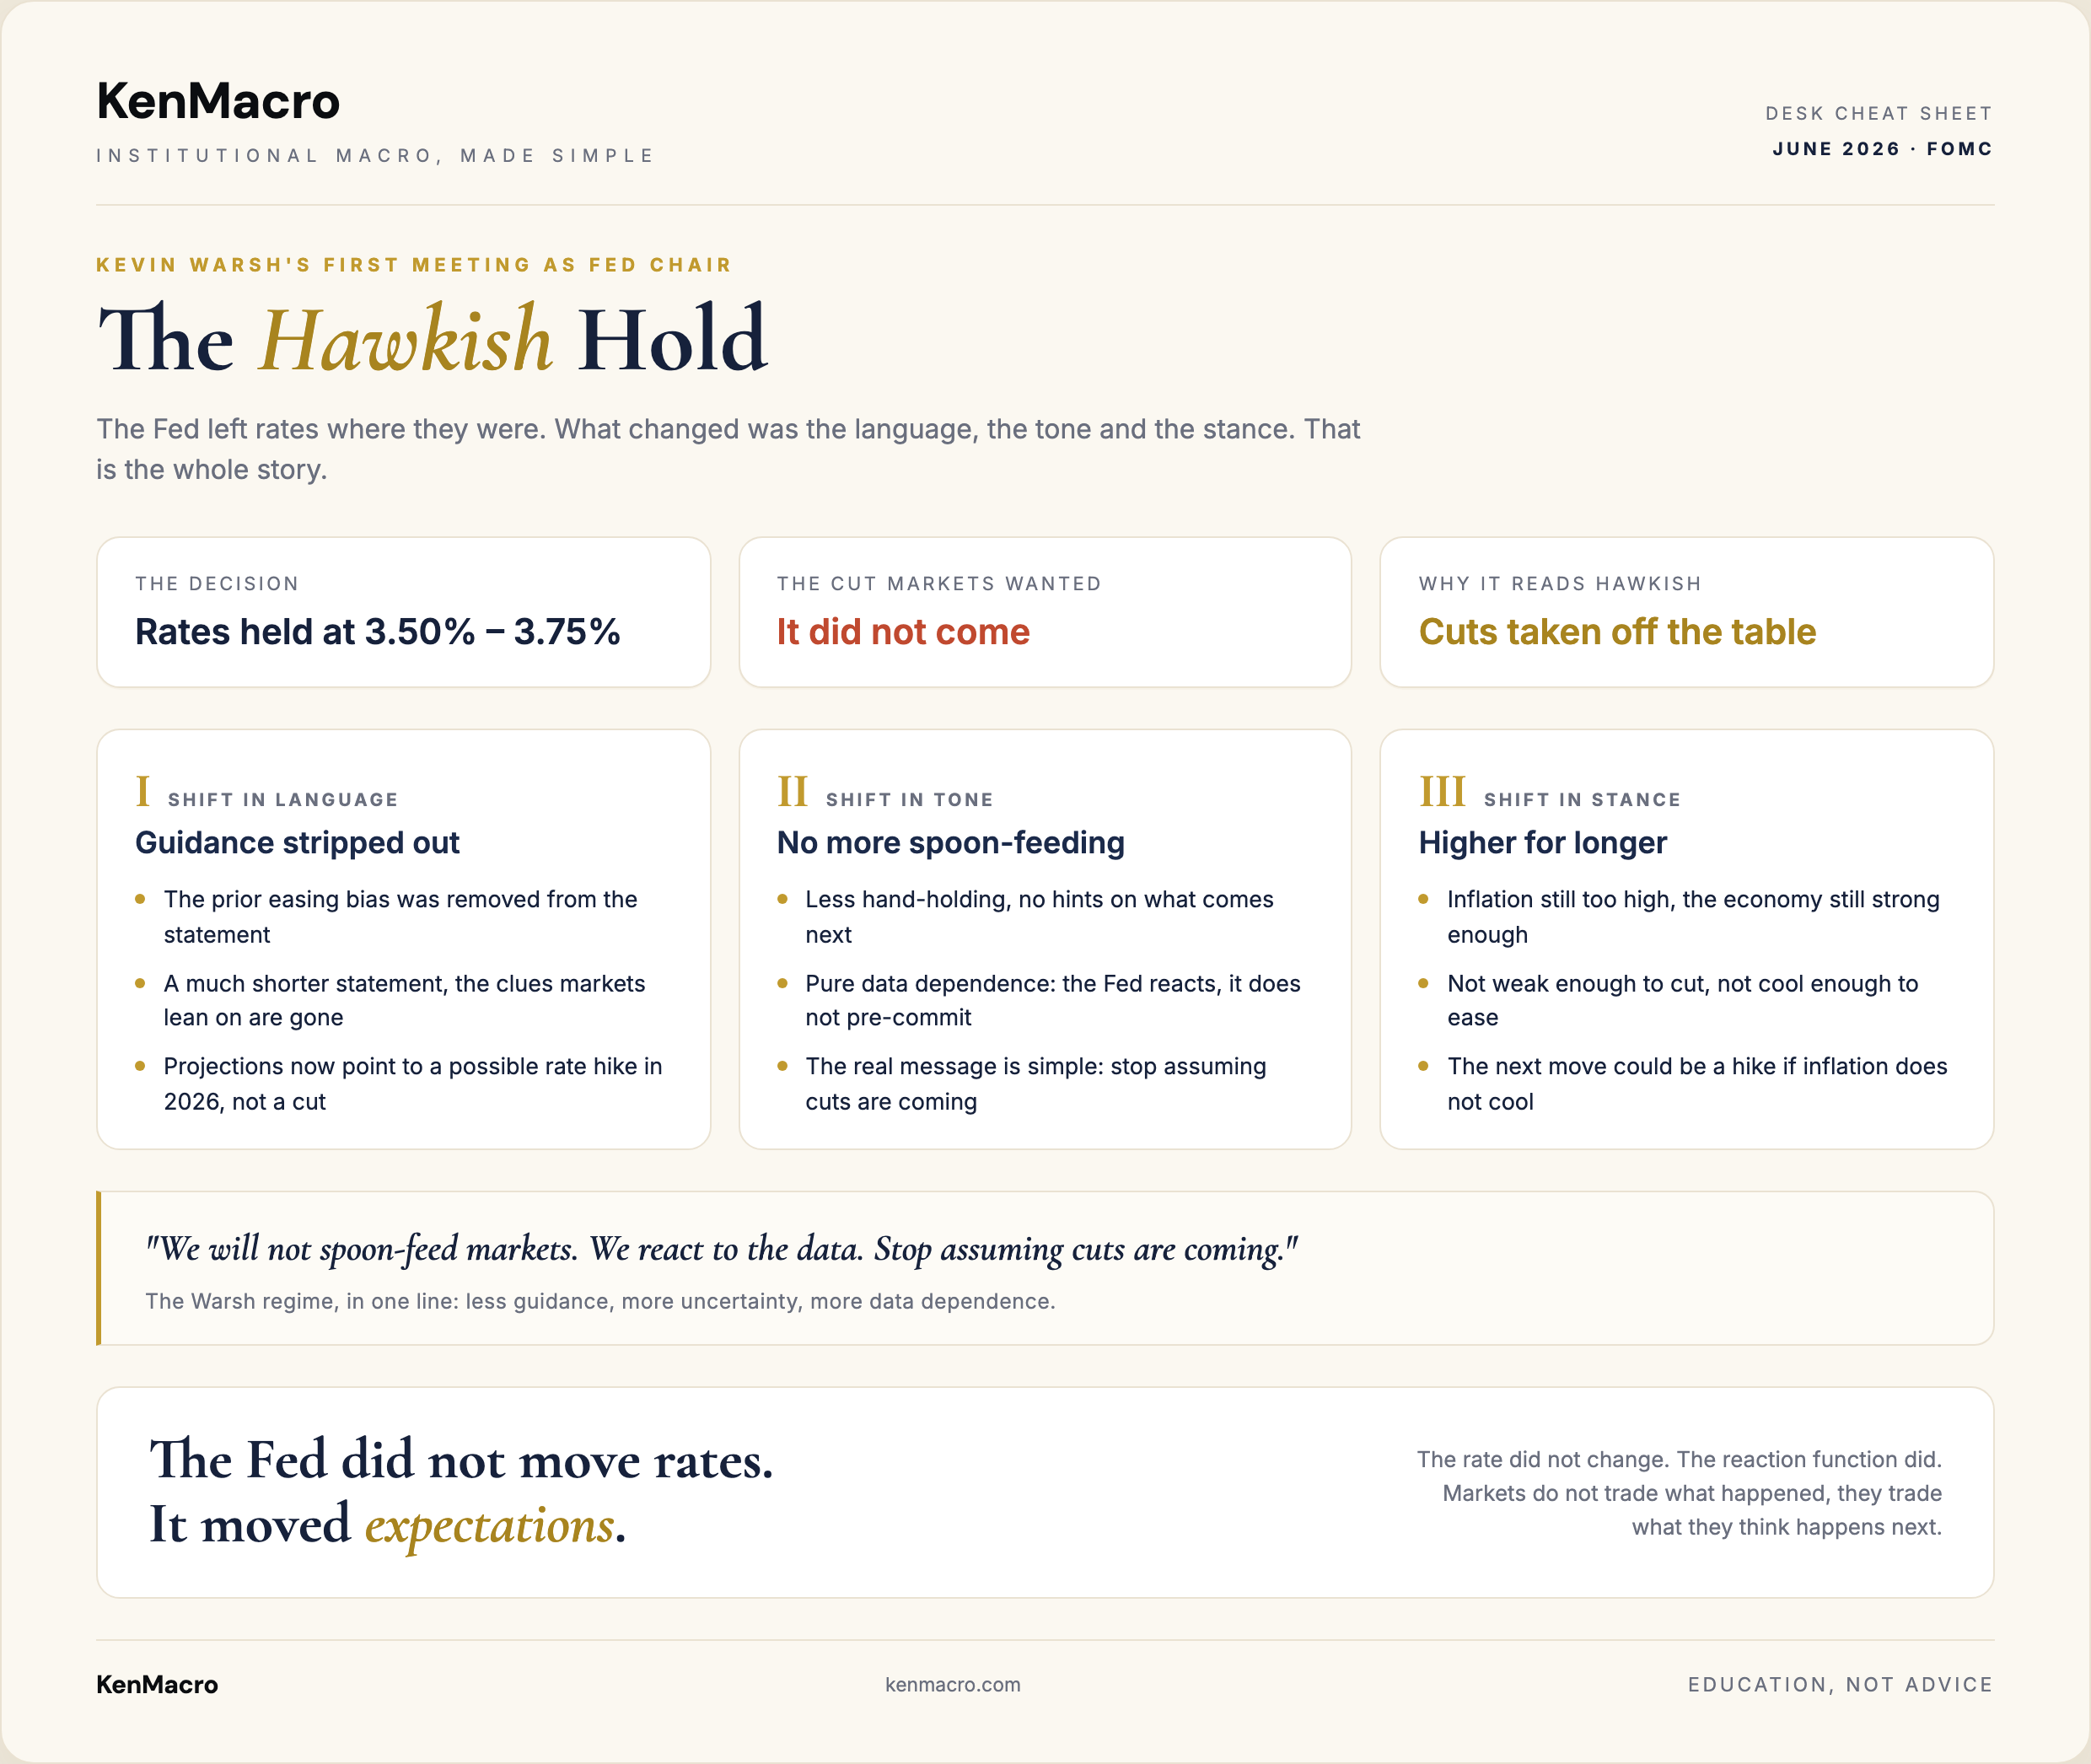
The Federal Open Market Committee left the target range at 3.50 to 3.75 percent on a unanimous 12 to 0 vote. That was the consensus. The rate was never going to be the story. What mattered was the projections, the statement language, and the press conference, and on all three Warsh delivered a meaningfully more hawkish posture than the market was positioned for.
The statement stripped its prior easing bias. The Summary of Economic Projections lifted the median 2026 dot to roughly 3.8 percent from 3.4 percent in March, which puts the median above the current midpoint of the target range. Read that again: the committee’s central tendency is now pricing a HIKE in 2026, not a cut. Roughly half the committee pencilled at least one 2026 hike. The hand that had been holding the market’s hand for the last two years let go.
Warsh’s press conference reinforced it. He leaned into pure data dependence, repeatedly declined to commit to a path, flagged sticky inflation, hot producer prices, and the Strait of Hormuz oil risk as reasons against easing, and made it clear the committee will not provide forward guidance the way the prior regime did. For a market trained for years on Fed hand-holding, that is the regime change.
This is the kind of single-event interpretation the MACRO MASTERY desk walked members through live as Warsh spoke. The pre-FOMC scenarios are archived in the desk’s FOMC June 2026 Warsh decision playbook, with the hawkish-hold scenario flagged as the highest-impact downside risk for the major pairs and gold.
Why is the dollar rising, the mechanics in plain English
If you are searching “why is the dollar rising” today, the answer fits in three sentences, but the mechanics matter, so we’ll do it properly.
A currency’s value is, at its core, a function of two things: the expected interest rate path of that currency relative to its peers, and the safety premium the world is willing to pay to hold it. Warsh just moved both variables in the dollar’s favour at the same time. The expected US rate path repriced higher (the dot plot did the work). The safety premium widened because a Fed that refuses to hand-hold the market raises the cost of being short the reserve currency in a risk-off regime.
The transmission is mechanical. Higher expected US rates push short-dated US Treasury yields up. The US 2Y, which is the most Fed-sensitive point on the curve, surged on the dot plot. Higher nominal yields net of inflation expectations equals higher REAL yields. Higher real yields raise the carry advantage of holding dollar-denominated assets versus euro, sterling and yen assets, where the policy paths are now diverging away from the Fed. Capital flows toward yield. The dollar gets bid.
That’s why the DXY broke 100.00 for the first time in over two months and is sitting at 100.23 this morning, having spiked as high as 100.40 post-decision. The higher low at 99.40 to 99.50 is the structural breakeven for this entire move. While that shelf holds on a daily close, the dollar bid is structural, not a blip.
The desk’s one-page cheat sheet on this FOMC, the same kind of clean one-page read members get every meeting.
The dot plot shift that broke the consensus
The dot plot is the chart that did the damage. The Federal Reserve’s Summary of Economic Projections publishes anonymous committee member projections for the path of the policy rate. In March, the median 2026 dot sat at 3.4 percent, comfortably below the current midpoint, implying the committee expected to be CUTTING from here. Yesterday’s SEP lifted that median to roughly 3.8 percent, ABOVE the current midpoint, implying the committee now expects to be HIKING.
That is a 40 basis point shift in the median path between two consecutive SEPs, and it happened under a brand new Chair on his first meeting. In dot plot terms, that is a regime change, not a calibration. The market had been pricing roughly two cuts into the front end of 2026. Some of that is now being unwound, and the more hawkish dot plot is forcing fast-money desks to flatten dollar shorts they had built ahead of the meeting.
This matters for one specific reason: forward-looking traders price the FED PATH, not the current rate. Even with the rate held at 3.50 to 3.75 percent, the dollar gets bid the moment the EXPECTED path lifts. That’s why the move was instant. The rate didn’t change. The path did. And the path is what trades.
The desk’s pre-meeting world interest rates dashboard showed exactly this divergence building: the ECB still has cuts priced for late 2026, the Bank of England is on a slow cut path, the Bank of Japan is the only G7 central bank pricing hikes, and the Fed was sitting in the middle, dovish-leaning. Warsh just pulled the Fed firmly into the hawkish-leaning camp, widening the rate differential against the euro and sterling in a single afternoon.
Trade the dollar regime with an edge
A trending, data-driven dollar tape punishes slow fills and wide spreads. The desk runs raw-spread, fast-execution books for exactly this kind of move. Get set up before the next print, on a broker the desk actually uses.
Vetted and route-checked by the desk:
Star Trader →Blueberry Markets →
Broker partnerships disclosed; the read above is the desk’s own and is education, not advice. Trading carries risk and most retail CFD accounts lose money.
Real yields, the dollar, and why gold fell
If you understand one thing about yesterday, understand this: real yields are the variable that determines where gold goes.
Gold pays no coupon, no dividend, no yield. The opportunity cost of holding it is whatever you give up by not holding a yielding asset instead. When real yields (nominal yield minus expected inflation) rise, that opportunity cost rises, and the marginal dollar rotates out of bullion into Treasuries. When real yields fall, the opposite happens and gold gets bid.
Yesterday, the dot plot lifted nominal yields at the front of the curve. The hawkish message also signalled the Fed will not let inflation expectations drift higher (because they refuse to ease into sticky inflation). Both moves together lifted real yields. The mechanical consequence: gold was rejected at the 4,345 to 4,350 barrier, where the 200-day moving average has been sitting near 4,340, and capital rotated out of the metal. The session flush low at 4,219 was the consequence of that rotation, not panic. It was discipline. Real yields rose, gold sold off.
What stabilised gold above 4,300 was not a Fed pivot, it was the interim US-Iran agreement to reopen the Strait of Hormuz. That is a geopolitical premium reset, separate from the rates story, and we will come back to it. But the rates story alone says gold stays capped under 4,345 to 4,350 while real yields hold or rise.
The XAUUSD desk note from this morning walks through the real-yield decomposition in more detail, and the MACRO MASTERY desk covers FOMC, NFP and CPI live as the prints land, which is when these decompositions move the most.
Why EUR/USD and GBP/USD are falling
The major pairs are the mirror image of the dollar bid. There is no separate story here, just the same story told from the other side.
EUR/USD broke the 1.1500 floor and now trades at 1.1513, a fresh three-month-plus low. The technical context matters: the pair had rejected its 1.1617 lower high on 15 June, which set up the downside structure, and the break of the 1.1500 round confirmed it. Below the current price, the next obvious liquidity sits at the 1.1435 2026 low. The euro side of this trade has its own dovish driver, the ECB is still pricing late-2026 cuts, but the dominant force is the dollar bid, not euro weakness in isolation.
GBP/USD rolled off the 1.3450 lower high and broke the 1.3300 round to 1.3296. Sterling has been the cleanest mirror of the dollar this cycle because the Bank of England is on a measured cut path while inflation in the UK remains sticky, which compresses the rate differential narrative on both sides. With the Fed now signalling no cuts, the dollar-side push dominates. Below 1.3300, the next round support is 1.3250, then the 1.3200 floor.
USD/JPY is the pair the desk watches most closely on dollar-bid regimes because the Bank of Japan is the only G7 hiking, which usually caps the upside on USD/JPY rallies. The fact that the yen also weakened yesterday tells you the dollar leg is doing most of the work, not the JPY leg. That asymmetry is what makes this dollar move structural, not a positioning squeeze.
The EUR/USD forecast desk note covers the structure in finer detail. Where the major pairs go from here depends almost entirely on whether the DXY holds the 99.40 to 99.50 higher low. A clean daily close back below that shelf, and the major pairs unwind. While the shelf holds, the path of least resistance for the pairs is lower.
What does a hawkish Fed mean for stocks?
Stocks are heavy this morning for one reason: equities are priced on discounted future cash flows, and a higher discount rate means lower present value. When the Fed lifts the expected path of the policy rate, the discount rate rises, and the present value of every future earnings dollar falls. That hits the highest-duration stocks hardest, which is why the Nasdaq led the downside.
The S&P 500 closed lower into the bell. The Nasdaq sold off more, because tech, semiconductors, and growth names have the longest duration. Rate-sensitive sectors (real estate, utilities, regional banks at the long end of the curve) got hit too. The defensive corners (consumer staples, healthcare) held in better, which is the textbook risk-off rotation inside equities.
The honest read is that the hawkish hold is not a recession signal. The Fed isn’t holding because growth is collapsing, they are holding because inflation is sticky and they refuse to ease into it. That is meaningfully better for earnings than a “cutting because growth is rolling” environment. But the multiple compression is real, and while the dollar bid and real yield uptick persist, equity rallies face a stiffer headwind than they did a week ago.
The framework here is simple: hawkish Fed equals multiple compression first, then earnings tested against the new discount rate. The first leg is mechanical. The second leg depends on the next round of earnings prints, which is why the desk’s macro calendar gets so much heavier from here. Every CPI, PPI, NFP, ECI, wage and consumer print now matters more than it did a week ago, because Warsh removed the Fed’s hand from the steering wheel.
The Hormuz wildcard cushioning gold and oil
Layered on top of the Fed story is a separate, two-sided wildcard: an interim US-Iran agreement to reopen the Strait of Hormuz.
The Strait carries roughly a fifth of global seaborne oil. The risk premium that had been sitting in crude (the war premium that had pushed gold and oil higher into the meeting) reset partially overnight. WTI eased on the agreement. Gold’s recovery above 4,300 from the 4,219 flush was partly the interim deal cushioning the bullion bid via a softer oil tape and a partial de-risking.
The wildcard is two-sided because an interim deal is not a final deal. If the talks collapse or the agreement is breached, the war premium reasserts, oil spikes, and the gold flush we saw yesterday gets unwound fast. If the talks hold and the path widens toward a durable deal, the geopolitical bid in gold compresses further and the metal stays capped under 4,345 to 4,350 by both the rates story AND the falling geo premium.
The desk treats this as a sentiment-modifier, not a base case. The Fed story is the structural driver. The Hormuz story is the modulator. Both matter, but they operate on different timeframes.
What the desk said before the meeting
This section is the part where, with respect, we have receipts.
The KenMacro desk publicly introduced Kevin Warsh as the incoming Chair before this meeting, walked members through his policy biography (he was the dissenter on QE in 2010, he has been openly critical of forward guidance, he favours data dependence over communication), and made the case for getting positioned for a more hawkish, less hand-holding Fed. The video walkthrough went out to the public list. The desk’s scenario playbook flagged the hawkish-hold path as the highest-impact downside scenario for EUR/USD, GBP/USD and gold, with the upside for the DXY framed around a clean break of the 100.00 round.
None of that was clever. It was structural. A new Chair on his first meeting always anchors the regime, and a Chair with a dissenter’s biography on QE was never going to lean into a dovish capitulation as his opening statement. The market was positioned for continuity. We were positioned for change.
This is the difference between reacting to a move and being positioned for it. Reacting means you read this article and now scramble to make sense of where prices are. Being positioned means you read the regime change two weeks ago, sized the view appropriately, and watched yesterday’s print confirm the thesis. The MACRO MASTERY desk caught the dollar upside read clean. Same stack a hedge fund analyst runs every morning, delivered into a Discord of serious traders.
Get this read every day
The desk’s daily macro pulse, live trade ideas with full reasoning, FOMC and CPI live coverage as prints land. The five-lens framework that flagged Warsh’s hawkish hold in advance.
Scenarios from here, weighted by the desk
The desk does not predict, it weights. Here are the three paths that matter from this morning, with the catalysts that flip them.
Scenario A: dollar bid extends (55 percent)
DXY holds the 99.40 to 99.50 higher low on a daily close basis, the 2Y stays bid, real yields hold the lift, and the dollar drifts toward the next liquidity at 100.40 (already touched post-decision) and then the 101.00 to 101.20 zone. In this scenario, EUR/USD tends to drift toward the 1.1435 2026 low, GBP/USD toward 1.3250 then 1.3200, and gold stays capped under 4,345 to 4,350. Catalyst: a hot CPI, hot wages, or hot PPI print in the next two weeks. The data dependence cuts both ways but starts the regime tilted hawkish.
Scenario B: consolidation, the move digests (30 percent)
DXY chops in the 99.40 to 100.40 range as the market waits for the next data print. Major pairs base out at current levels without breaking the next liquidity zones. Gold stabilises between 4,250 and 4,345. This is the path if the next round of US data lands in line with consensus and gives neither side the ammunition to extend. Volatility around individual prints rises because Warsh removed the safety net.
Scenario C: dollar bid fades (15 percent)
DXY closes back below the 99.40 to 99.50 shelf, real yields roll over on a soft CPI or PPI print, the major pairs unwind their breaks, and gold reclaims the 4,345 to 4,350 barrier. This is the lowest-probability path because the dot plot shift was structural, not tactical, and a single soft print is unlikely to reverse the regime. But it is the path that invalidates the entire dollar-bid thesis, so it has to be on the board.
Key levels worth watching
Key Levels Worth Watching
- DXY 100.00 round, now floor. First time broken in over two months. The post-decision spike high at 100.40 is the first liquidity above current price, then the 101.00 to 101.20 round zone.
- DXY 99.40 to 99.50, the higher low shelf. Structural breakeven for the entire dollar move. A daily close below it invalidates the bid.
- EUR/USD 1.1500 round, now ceiling. Broken to the downside. The 1.1617 lower high (15 June) is the rejection that set up the break. Downside liquidity at 1.1435, the 2026 low.
- GBP/USD 1.3450 lower high and 1.3300 round. Lower high rejected, round broken. Below current price the next round supports are 1.3250 then 1.3200.
- Gold 4,345 to 4,350 barrier. Sits with the 200-day moving average near 4,340. Rejected on the FOMC print. While capped, downside liquidity sits at 4,250, then 4,200, then 3,800 round.
- Gold 4,219 session flush low. The defended low from the post-decision flush. A break below it on a daily close reopens the 4,200 then 3,800 path.
Each of these levels qualifies under the desk’s named taxonomy: round numbers at the asset’s natural granularity, prior-day extremes with dated context, the 200-day as a structural anchor with price confluence, and a defended session low. None of them are arbitrary. Each of them tells you something about where the next pool of liquidity sits.
The DXY forecast desk note goes deeper on the dollar structure. The MACRO MASTERY desk updates these levels intraday as the tape moves.
Cross-asset impact dashboard
| Risk-off / Down | Bid / Up |
|---|---|
| ↓ EUR/USD 1.1513 (break of 1.1500) | ↑ DXY 100.23 (break of 100.00) |
| ↓ GBP/USD 1.3296 (break of 1.3300) | ↑ US 2Y yield (Fed-sensitive surge) |
| ↓ Gold 4,302 (flushed to 4,219) | ↑ Real yields (dot plot transmission) |
| ↓ S&P 500, Nasdaq leading lower | ↑ US dollar carry advantage |
| ↘ WTI softer (Hormuz interim deal) | ↑ Defensive equity rotation |
Asset by asset, what’s priced
| Asset | What’s priced | Direction |
|---|---|---|
| DXY 100.23 | Repriced Fed path higher, carry advantage widened, structural bid while 99.40 to 99.50 holds. | ↑ Constructive |
| EUR/USD 1.1513 | Rate differential repriced against the euro, 1.1500 floor broken, 1.1617 lower high intact. | ↓ Heavy |
| GBP/USD 1.3296 | 1.3300 round broken, 1.3450 lower high in place, BoE-Fed differential narrowing the wrong way for sterling. | ↓ Heavy |
| Gold 4,302 | Real yields up, opportunity cost rising, capped under 4,345 to 4,350; Hormuz interim deal cushioning the downside. | ↘ Capped |
| S&P 500 / Nasdaq | Multiple compression from higher discount rate, Nasdaq longest-duration so leading lower. | ↓ Heavy |
| WTI crude | Interim US-Iran Strait of Hormuz deal compressing the geo premium, two-sided wildcard remains. | ↘ Softer |
The data dependence trap and what to watch next
Here is the part that most post-FOMC coverage will miss this morning.
By stripping forward guidance, Warsh has told the market that every data print from here is a live event. Under the prior regime, the committee held the market’s hand through inflation prints, jobs prints, wage prints, telling everyone in advance how to read each release relative to the policy path. That communication has been turned off.
That means volatility around each release rises mechanically. The next CPI print will not be filtered through a press conference primer. The next NFP will not be wrapped in soothing language. The next PPI will land naked, and the market has to do its own interpretation work in real time. The BLS release calendar just got more important than it has been in three years.
The single most important variable from here is that releases now move more, not less. The carry trade gets harder. The vol-selling business gets harder. And the macro framework, the five-lens read that combines rates differentials, capital flow, order flow, technicals and liquidity, gets more valuable because the Fed isn’t doing the synthesis for you any more.
This is exactly the regime the MACRO MASTERY desk was built for. The five-lens framework, including the daily-routine dashboard, is unpacked in detail inside the desk archive.
What the ECB and BoE do next
The dollar story is half the trade. The other half is whether the ECB and Bank of England now have to react.
The ECB’s policy calendar shows the next Governing Council meeting is the obvious test. The euro side currently has cuts priced for late 2026. A weaker euro from the dollar move actually helps the ECB’s inflation transmission (imported inflation rises), which gives them more reason to hold off on cuts, which would partially offset the EUR/USD downside. The risk is that the ECB doesn’t move fast enough, the dollar bid extends, and the divergence widens further.
The Bank of England is on a measured cut path with sticky UK services inflation as the constraint. A weaker sterling makes that path harder because imported inflation works against them. The BoE could end up holding a slower cut path than priced, which would partially defend sterling, but again the dominant force is the dollar leg of the trade, not the sterling leg.
The path of least resistance for the major pairs is lower while the dollar bid holds. That holds until the ECB or BoE pushes back, or until US data softens enough to roll real yields over.
What would invalidate this view
What would force a reassessment
The dollar-bid thesis breaks on three specific developments, in order of likelihood.
1. A soft US data print. A meaningfully soft CPI, PPI, wages or NFP that flips the data-dependence read dovish. The dot plot move was hawkish on the SEP, but the committee is now openly data-dependent, so a single weak print can roll real yields lower fast.
2. DXY daily close below 99.40. The higher low shelf. A clean daily close below it tells you the structural bid has failed and the dollar is unwinding the FOMC move. Major pairs would reclaim their broken floors in that scenario.
3. A geopolitical reset that reignites the safe-haven gold bid. If the Hormuz interim deal collapses or a new geopolitical shock lands, the gold bid reasserts and partially offsets the rates-driven gold flush, breaking the rates-only read on bullion.
Final takeaway
The dollar is rising because Kevin Warsh just ended the easing cycle that was priced into the curve, and the market is repricing in real time.
This is not a positioning squeeze, it is a regime change. The dot plot moved 40 basis points higher in three months under a new Chair on his first meeting. Real yields lifted. The dollar broke 100.00. The major pairs broke their floors. Gold flushed and stabilised on a geopolitical cushion that may or may not hold. The next leg depends on US data, which now matters more because Warsh refuses to do the market’s synthesis for it. The level that defines this entire regime sits at 99.40 to 99.50 on the DXY. Above it, dollar-bid. Below it, reassess.
“Reacting to a move and being positioned for it are two different jobs. The first is luck. The second is process.”
In short
Warsh’s first FOMC was a hawkish hold, the dot plot lifted the 2026 median to ~3.8 percent flipping the bias from cut to hike, and the dollar broke 100.00 with EUR/USD breaking 1.1500 and gold rejected at 4,345 to 4,350. The dollar bid is structural while DXY holds 99.40 to 99.50, and every US data print now matters more because Warsh turned off the forward guidance safety net.
Join MACRO MASTERY
The institutional macro intelligence desk. The exact stack a hedge-fund analyst runs every morning, delivered into a Discord community of serious traders.
07:00 London daily macro pulse. Live trade ideas with entry, target, stop, invalidation. FOMC, NFP, CPI live coverage as the prints land. BTC whale-flow signals. G7 central-bank rate pricing. Weekly performance scorecard, every win AND loss.
Free for life through our Blueberry Markets partnership (ASIC regulated). Members trade through Blueberry, get the entire desk in return. Funds stay with the broker in your name, withdrawable any time. Pure alignment, not a subscription.
Welcome DM lands instantly. Non-US residents only for now, US partner Q3.
Educational analysis only. Past performance does not guarantee future results. Manage risk against your own portfolio.
Related reading
- FOMC June 2026, the Warsh decision scenario playbook
- DXY dollar index forecast, 18 June 2026
- Gold price forecast XAUUSD, 18 June 2026
- EUR/USD forecast, 18 June 2026
- World interest rates dashboard
FAQ
Why is the US dollar rising in June 2026?
The US dollar is rising because Kevin Warsh’s first FOMC as Chair on 17 June 2026 delivered a hawkish hold. The committee left rates at 3.50 to 3.75 percent unanimously, but stripped the easing bias from the statement and lifted the median 2026 dot to roughly 3.8 percent from 3.4 percent in March, above the current midpoint. That flips the policy signal from a cut bias to a hike bias. Higher expected US rates push real yields up, widen the dollar’s carry advantage versus the euro, sterling and yen, and pull capital into dollar-denominated assets. DXY broke the 100.00 round to 100.23 and is sitting on a higher low at 99.40 to 99.50.
What did the Fed decide in June 2026?
The Federal Open Market Committee held the target range at 3.50 to 3.75 percent on a unanimous 12 to 0 vote at the 17 June 2026 meeting. The rate decision was consensus. The hawkish surprise was the projections and tone. The Summary of Economic Projections raised the median 2026 policy rate to approximately 3.8 percent, up from 3.4 percent in the March SEP, putting the central tendency above the current midpoint and implying a hike, not a cut. Roughly half the committee pencilled at least one 2026 hike. Chair Warsh leaned into pure data dependence and explicitly less forward guidance.
Why is gold falling after the Fed decision?
Gold is falling because the hawkish dot plot lifted US real yields. Gold pays no yield, so the opportunity cost of holding it is the yield given up by not holding Treasuries. When real yields rise, that opportunity cost rises and capital rotates out of bullion into yielding assets. Gold was rejected at the 4,345 to 4,350 barrier, where the 200-day moving average sits near 4,340, and flushed to 4,219 before stabilising above 4,300. The stabilisation came from an interim US-Iran agreement to reopen the Strait of Hormuz, which softened oil and partially offset the rates-driven flush.
What does a hawkish Fed mean for stocks and the Nasdaq?
A hawkish Fed lifts the discount rate used to value future earnings, which compresses equity multiples. The effect is largest on the longest-duration stocks, which is why the Nasdaq led the downside after the FOMC. The S&P 500 also closed lower. Rate-sensitive sectors (tech, real estate, regional banks) get hit hardest. Defensive sectors (staples, healthcare) hold in better. The hawkish hold is not a recession signal, the Fed is holding because inflation is sticky, not because growth is collapsing. Equity rallies face a stiffer headwind while real yields stay bid.
Will the US dollar keep rising?
The dollar’s structural bid holds while DXY closes daily above the 99.40 to 99.50 higher low shelf. Next liquidity sits at the post-decision spike high of 100.40, then the 101.00 to 101.20 round zone. The thesis breaks on a meaningfully soft US data print (CPI, PPI, wages, or NFP) that rolls real yields over, on a clean DXY daily close below 99.40, or on a major dovish pivot from the ECB or Bank of
From the desk, free
Get the macro framework the desk actually trades
The same regime-first framework behind every call on this site. Free. No spam, unsubscribe anytime.
Trading USD pairs?
Platform, spreads and execution decide more than the call does. Check your broker route before opening an account.
Continue reading
From the desk
Part of the Dollar and DXY Forecast hub, the desk’s living guide, kept current as markets move.
Where this gets traded
CPI and FOMC are the moments a weak broker is exposed, spreads gap and fills slip. See the KenMacro desk guide to the best brokers for trading the print.
Read the desk guide →