Stocks Today: S&P 500 7420 & Nasdaq 29350 Pre-Breakout Squeeze
Open Vantage →
The desk’s three-broker stack
Pick the broker that matches your priority. Vantage for Tier-1 regulation plus Lloyd’s $1m insurance. E8 Markets for funded trader capital with KENMACRO 5% off any challenge.
Capital at risk. CFD and margin trading carry significant risk of loss. Past performance does not guarantee future results.
The S&P 500 record close did not blink. CPI came in hot enough to scare the tape mid-session, the Iran rejection headlines hit the wires before the bell, and the bid still stepped through. The desk has watched this exact mechanic seven times since February. It keeps working until it doesn't.
The desk's read: higher lows printed, the breakout is the next move
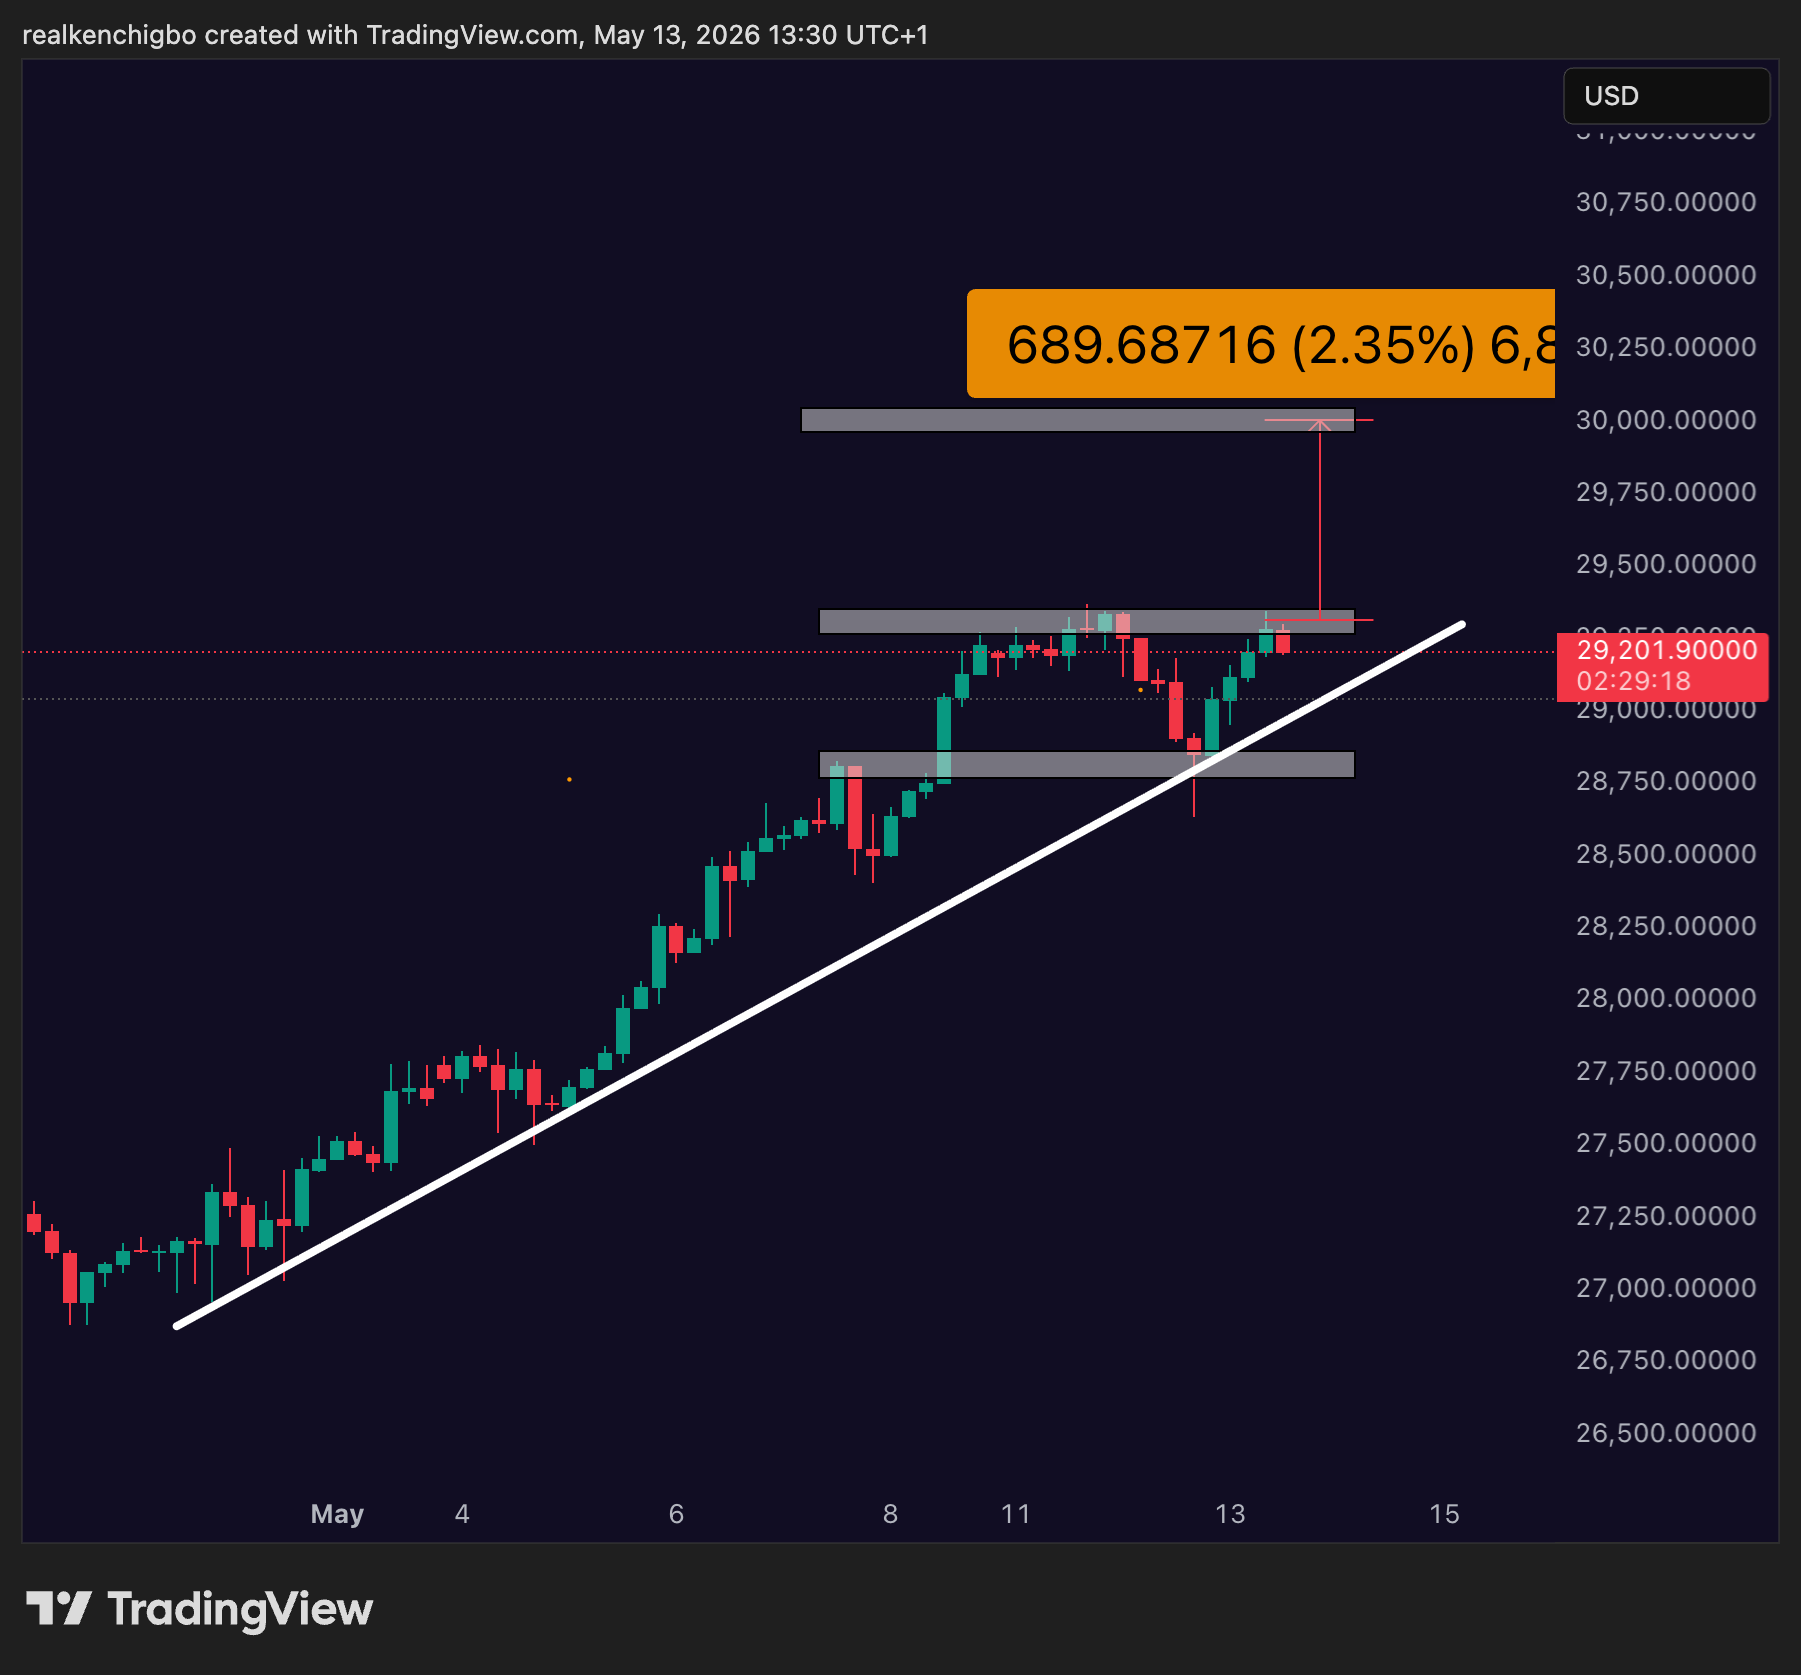
Both US indices ran the same script yesterday. The S&P 500 printed a higher low and bounced toward the 7,420 weekly cap before stalling. The Nasdaq 100 printed a higher low and traded into the 29,300-29,350 supply zone, where Monday's highs and the prior-week swing sit on the same shelf. Higher lows + a defined resistance bracket = the textbook continuation setup. The market is not waiting for permission. It is waiting for the catalyst that breaks the bracket.
The Nasdaq side carries the structural narrative. AI-infrastructure leadership remains the bid. Hyperscaler capex commentary, chip-supply normalisation, and the corporate-buyback flow are all stacked on the same direction. The 29,200 spot is sitting roughly 0.5 per cent below the 29,350 cap. A push into premium territory (above 29,350) that pulls back into discount and retests Monday's highs as new support is the institutional continuation pattern. If the retest holds, the next magnet is the 30,000 psychological round. That is roughly a 2.7 per cent move from the current bracket, a real distance with real allocator-PnL stacked behind it.
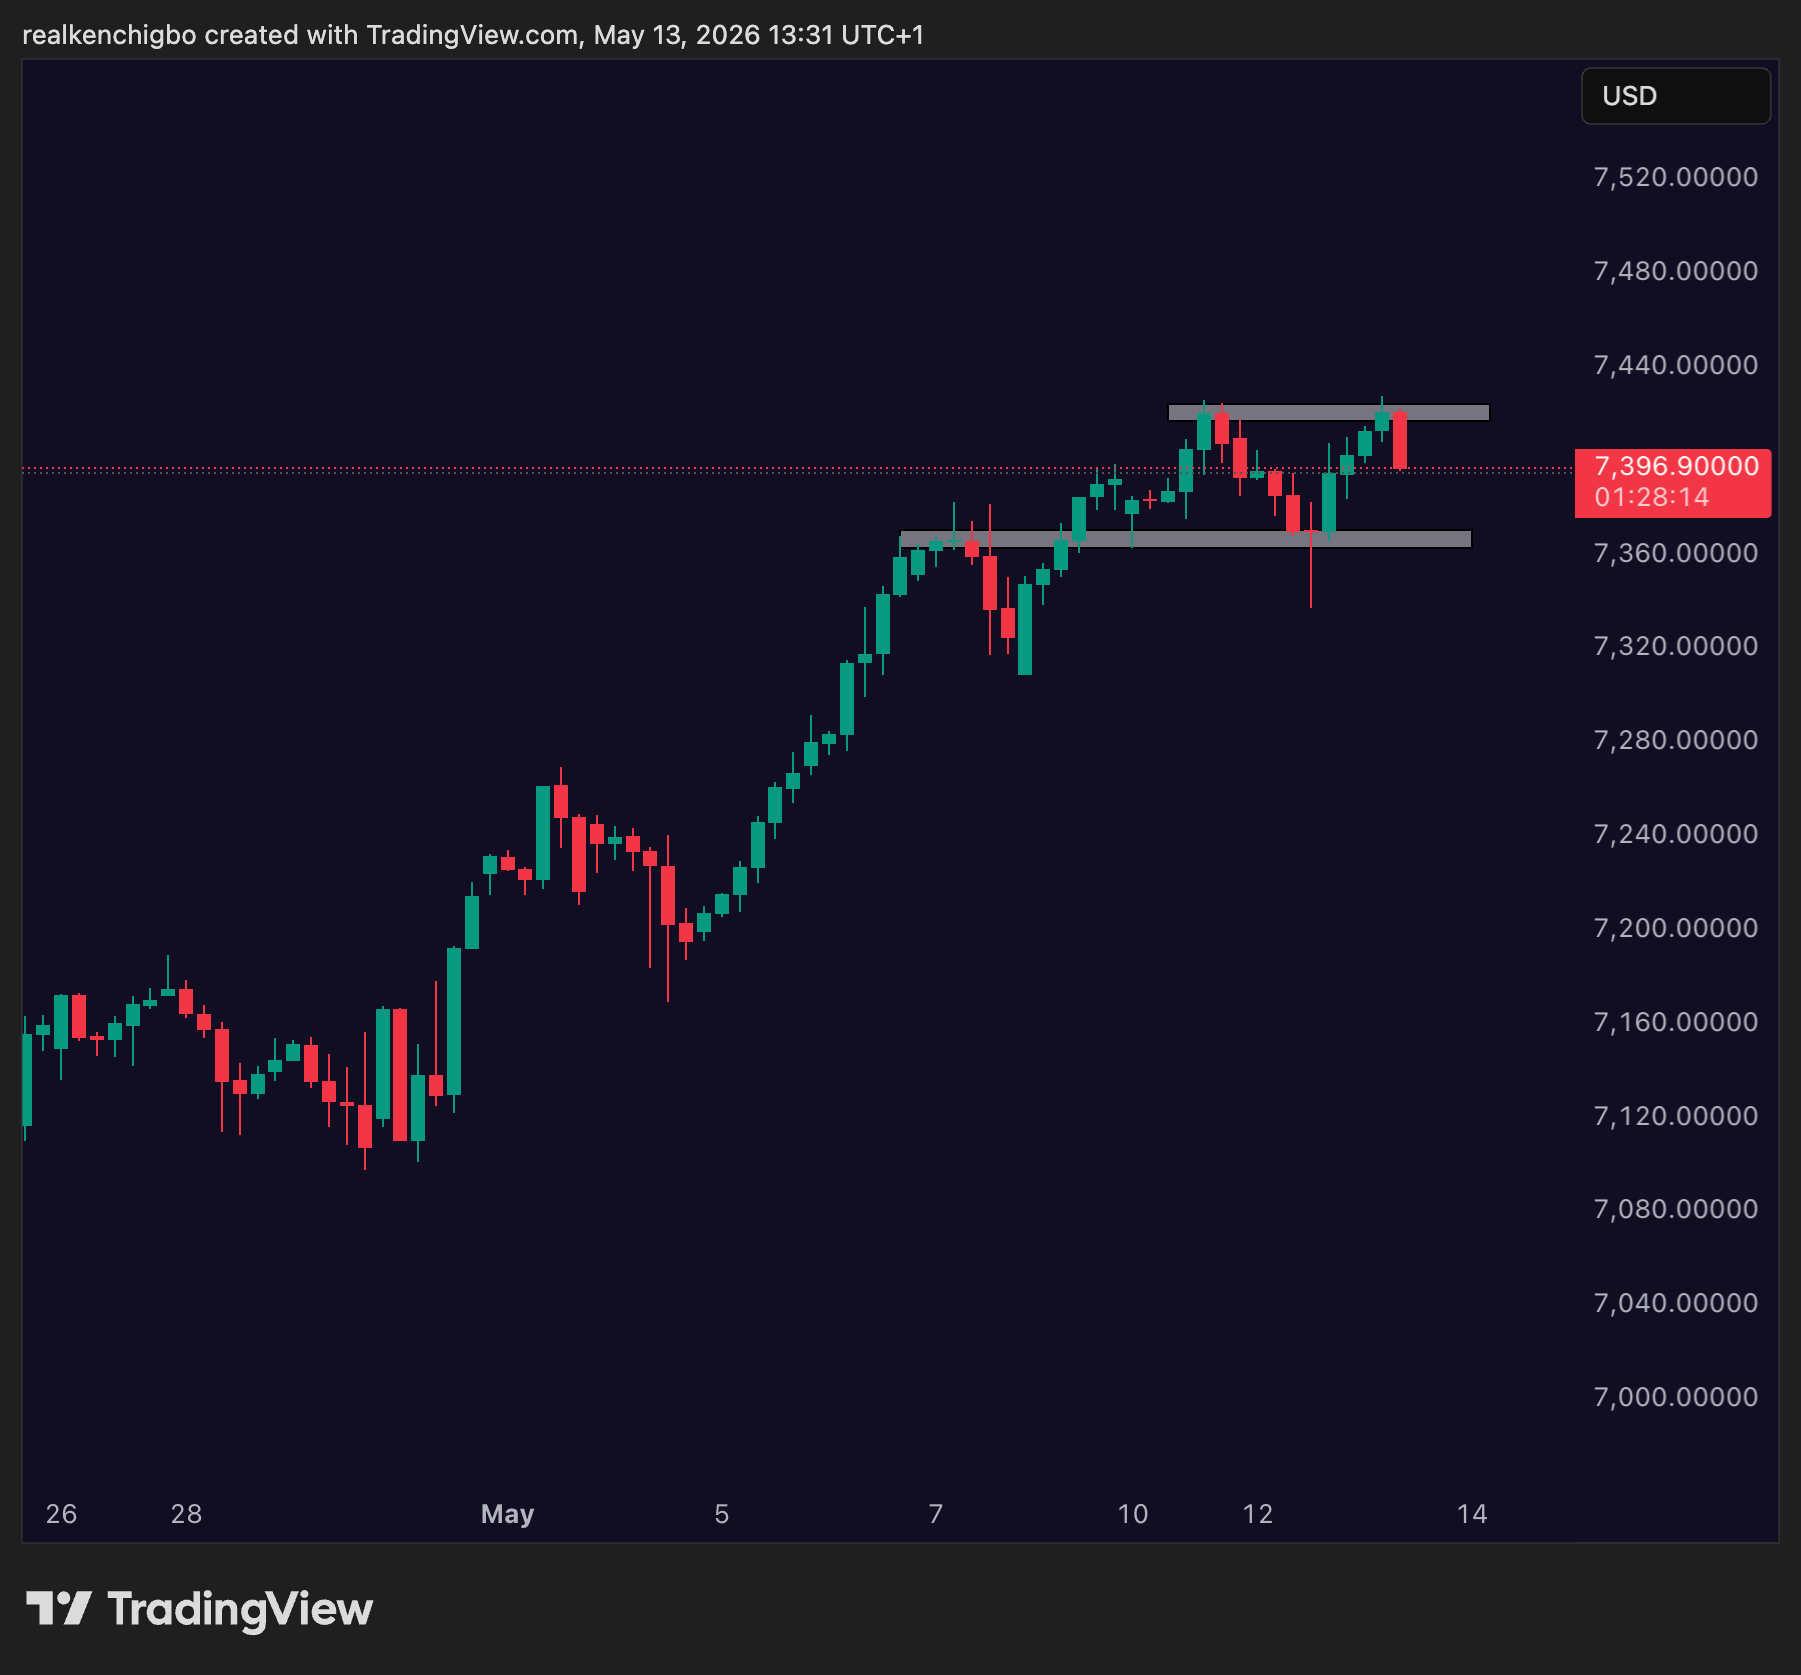
The S&P 500 traces the same arc one timeframe ahead. Spot at 7,396.90 sits roughly 0.3 per cent below the 7,420 weekly cap. The 7,360 shelf below is where yesterday's higher low printed and where the institutional bid stepped in mid-session. Break and close above 7,420 sets the 7,500 round as the magnet, a half-per-cent move where every recent rally has paused before the next leg. The pattern on the SPX is shorter and tighter than the Nasdaq's, which means a break here may resolve first and lead the Nasdaq breakout by hours, not days.
Cross-asset framing keeps the dip-buy thesis credible. The VIX is subdued, real yields are bracketed in their own coil, DXY is range-trading around the 100 handle, and the gold tape we covered earlier this morning is also coiled in a tight $100 range. Four coiled cross-asset patterns simultaneously is a regime indicator: indecision compresses across the whole tape, then resolves in a single coordinated move. The risk to the dip-buy thesis is an Iran/Hormuz headline that snaps the war-premium back into the bid and forces a risk-premium re-pricing across equities. That is the asymmetric tail.
The mechanical read for traders: the breakout is the move, the retest is the entry framework, the higher-low structure is the invalidation line. Lose the higher low, lose the setup. The desk's reading is that the AI-leadership flow and the buyback bid keep the higher-low intact unless a geopolitical headline forces a step-change. Without that headline, both indices grind toward their next round-number magnets.
- 29,300, 29,350 , heavy supply zone, Monday's highs and the week's highs stacked together. Bracket cap. Break + close above and the institutional continuation script triggers.
- 30,000 , next psychological round. Magnet if 29,350 cracks. Roughly 2.7 per cent of headroom.
- 28,650, 28,800 , supply-flip-to-support consolidation zone. Yesterday's higher low printed at the top of this shelf. The institutional bid lives here.
- Diagonal trendline , rising support from the late-April lows. The structural uptrend invalidation. Lose it, lose the regime.
- 7,420 , week's high. Bracket cap. The level every recent rally has stalled at. Break + close above is the continuation trigger.
- 7,500 , next psychological round. Magnet if 7,420 cracks. The half-per-cent path institutional flow tracks.
- 7,360 , supply-flip-to-support shelf. Yesterday's higher low printed here. Range floor for the current bracket.
- 7,320 , prior swing low. Regime-change level if 7,360 cracks. The structural invalidation for the current bullish leg.
By Ken Chigbo · Founder, KenMacro · 18+ years in markets, London trading floor and institutional FX
Quick Answer
- ☐ SPX printed another S&P 500 record close yesterday at 7,124 (+0.23%), Nasdaq leads at 26,923 (+0.54%).
- ☐ VIX at 17.92 says complacency, but the level is consistent with structurally supported risk regimes, not euphoria.
- ☐ AI-infrastructure capex commentary plus hyperscaler buyback flow is the structural bid under NDX outperformance.
- ☐ Dow lags at 49,153 (-0.32%): cyclical breadth is thinning even as the tape prints highs.
- ☐ Gold at $4,708 (+0.66%) and silver at $88.07 (+3.45%) rallying alongside equities is the tell that real yields are doing the heavy lifting.
- ☐ The level that matters: SPX 7,100 round support. Below it, the dip-buy mechanic gets its first real audit since February.
- ☐ DXY at 98.46 firm but not bid; USDJPY at 157.74 says carry is back on, which historically extends equity risk.
Jump to:
- What actually happened into yesterday's S&P 500 record close
- The Nasdaq AI bid: structural, not narrative
- Why CPI did not break the tape
- Inside the dip-buy mechanic, the real version
- Cross-asset confirmation and contradiction
- The Iran tail and how the tape is pricing it
- The breadth problem nobody is talking about
- Scenarios into the NY session
- Key levels worth watching
- What would invalidate this view
- Final takeaway
What actually happened into yesterday's S&P 500 record close
The S&P 500 closed at 7,124.64 (Yahoo Finance / TwelveData composite, 2026-05-12 NY close), another record print on a session that should not have produced one. CPI dropped at 13:30 BST and the headline came in firmer than the desk expected on services ex-housing, the sticky component that has kept the Fed honest for three quarters. The kneejerk was a 35-handle drop on SPX inside fifteen minutes. Then the bid stepped in.
By 16:00 New York the index had not only recovered, it had pushed through the prior all-time. Nasdaq did the same with more conviction, finishing at 26,923.65 (+0.54%) on AI-infrastructure leadership. Dow lagged at 49,153.60 (-0.32%), which is the part of the tape that should worry anyone reading this as a clean breakout. Cyclicals did not confirm. Industrials did not confirm. The breadth was tech, tech, and a touch more tech.
VIX sat at 17.92 (Yahoo Finance, 2026-05-13 European morning) through the session and into this morning. That is a complacency print on the surface and a coiled-spring print under the hood, depending on which side of the dip-buy you sit on. The desk has been tracking VIX behaviour through CPI prints since the 2022 inflation shock, and 17.92 with a positive risk-event impulse is consistent with what we call the "structurally underpriced tail" regime, not the "euphoria" regime.
The Nasdaq AI bid: structural, not narrative
Here is the part the financial press keeps getting wrong. The AI bid in NDX is not a sentiment trade. It is a capex flow trade. Hyperscaler guidance over the last two earnings cycles has lifted forward capex commitments by an order of magnitude that the sell-side modelled fully into multiple expansion for chip suppliers and infrastructure names. When those capex numbers print and the hyperscalers reiterate, the AI-infrastructure complex catches a structural bid that runs independent of the broader macro tape.
That is why CPI did not derail NDX yesterday and it is why the index is sitting at 26,923 today. The capex commentary from the hyperscaler cycle that closed last month did not unwind. Chip-supply normalisation, the bottleneck that throttled 2024-2025 deliveries, is being talked about as resolved on every recent investor call. The full live read on this is the kind of thing that drops daily inside the MACRO MASTERY desk, the framework for separating narrative AI from capex-flow AI is one of the desk's running threads.
Tech weight inside NDX means that even a moderately positive print from the AI-infrastructure complex drags the entire index higher. The DAX confirms a version of this: 24,128.13 (+0.72%) on European semiconductor and industrial-tech exposure. The FTSE, with its energy and financial tilt and no equivalent tech weight, sits flat at 10,265.11 (-0.00%). That spread between DAX and FTSE this morning is the same tech-leadership signal that is pulling NDX above SPX above DJI.
Get the framework the desk runs every morning. Free. No card. The same institutional structure the MACRO MASTERY desk uses on every read.
Why CPI did not break the tape
CPI came in firm on services ex-housing. That should have hit equities, lifted DXY harder, sent gold lower on the rates impulse, and steepened the front of the curve as the market priced out cuts. None of those reactions held past the first thirty minutes. The desk's read on why: the market is no longer trading CPI as a Fed-reaction-function input. It is trading CPI as a confirmation of the disinflation glide path that the Fed has already committed to via communication, regardless of any single print.
This is the post-pivot regime in its cleanest expression. Once the Fed has signalled the direction, individual data points stop moving the meta-narrative. They move the daily tape, they generate the 30-minute vol, but they do not change the strategic positioning. Real yields are doing the work. Gold at $4,708.6 (+0.66%) ripping higher into a hot CPI print is the giveaway: real yields are compressing despite nominal yields holding. That is the equity-friendly combination.
For the full mechanism on how real yields drive cross-asset flow, the desk's real yields explained deep-dive walks through the decomposition. The short version: when nominal yields hold and breakevens rise, real yields fall, and risk assets get a tailwind. That is exactly the tape we are reading this morning.
Inside the dip-buy mechanic, the real version
The dip-buy is not retail. The desk needs to be clear on this because the financial Twitter version of the dip-buy is "BTFD" and the institutional version is something completely different. What we have been watching since February is a structural mechanic with four underpinnings.
First, Fed-pivot pricing. SOFR futures are pricing a continuation of the cutting cycle that started in late 2025. As long as the OIS curve says cuts, real-money allocators treat any equity drawdown as a duration-substitute entry rather than a risk-off signal. The drawdown gets bid because the alternative, sitting in cash, gets penalised by the rate trajectory.
Second, corporate buybacks. The 2026 buyback authorisations announced in Q1 earnings season ran above consensus across the S&P 500. Buyback desks have a mechanical instruction set: execute on weakness, fade on strength, complete the authorisation by year-end. They are price-insensitive bidders inside a defined window, and that window opens every time the index pulls back 1-2%.
Third, systematic vol-targeting. When VIX sits at 17.92 and realised vol compresses, vol-targeted strategies (risk-parity, vol-control funds, certain CTAs) are net buyers on any vol expansion that resolves quickly. Yesterday's 35-handle CPI drop and recovery is the textbook fuel for these flows. The vol came in, the algos added.
Fourth, the AI capex bid we just covered. Independent of the macro tape, the AI-infrastructure complex has its own demand cycle that does not unwind on a CPI print.
Stack those four and you get a tape where the dip is structurally bid for reasons that have nothing to do with sentiment. The risk, and there is one, is that all four are correlated to the same underlying assumption: that the Fed pivot holds. If that assumption breaks, all four mechanics unwind together. That is the tail.
Cross-asset confirmation and contradiction
The S&P 500 record close does not sit in isolation. The cross-asset tape is sending mixed messages this morning, and the desk's job is to read which signals confirm the equity story and which contradict it.
Confirming the risk-on read:
- USDJPY at 157.742 (+0.32%), Yahoo Finance, this morning. Yen weakness above the 157.50 round level is consistent with the carry-trade reactivation that historically extends equity risk regimes.
- VIX at 17.92 (-0.39%). Subdued and falling further despite yesterday's intraday vol.
- DAX at 24,128.13 (+0.72%). European tech and industrial-tech exposure confirming the global AI-infrastructure bid.
- ETH at $2,304.53 (+1.31%). Crypto risk-asset confirming, even as BTC at $80,634.53 (+0.17%) is muted.
Contradicting the clean risk-on read:
- Gold at $4,708.6 (+0.66%) and silver at $88.07 (+3.45%) rallying. Precious metals at these levels alongside equity records is the tell that the underlying driver is real-yield compression and dollar-pricing concerns, not pure growth optimism.
- DJI at 49,153.60 (-0.32%) lagging on a record-close session. Cyclical breadth is thinning.
- WTI at $102.01 (-0.17%) and Brent at $107.86 (+0.08%) sitting on a residual Iran premium. The geopolitical tail is in oil, not equities.
- GBPUSD at 1.3507 (-0.72%) and EURUSD at 1.1721 (-0.50%) softening. DXY at 98.466 (+0.18%) firmer. The dollar is not following the risk-on script cleanly.
The contradictions matter more than the confirmations because they tell you where the regime is fragile. Gold and silver ripping with equities at records means a chunk of capital is hedging the dollar-debasement / fiscal-dominance tail even while it stays long risk. That is rational, not bearish, but it caps the upside on dollar-denominated index multiple expansion if the gold bid keeps grinding higher.
For the full dollar dynamic, the desk's dollar smile theory framework explains why DXY at 98.46 with risk-on equities is the "valley" of the smile and what reactivates either edge.
FCA, ASIC and FSCA regulation. Lloyd's of London supplementary client-fund insurance up to one million dollars per client. Raw-spread ECN execution.
The Iran tail and how the tape is pricing it
Iran rejected the latest diplomatic framework before yesterday's open. Six months ago, that headline produces a 1.5% equity gap lower, oil up 4%, gold up 1%, and a sustained risk-off bid through the session. Yesterday it produced a 30-minute equity wobble that got bought, oil softening into the European afternoon (WTI -0.17%), and the geopolitical premium leaking out of every asset except gold.
The desk's read: the market is exhausted on the Iran story. Not because the risk is lower, but because the headline frequency has habituated price action. The same mechanism that made Russia-Ukraine headlines a non-event by mid-2023 is now working on the Iran tape. The risk premium is being amortised across so many headlines that no single one moves the asset class anymore.
That is dangerous. The market is structurally underpricing the binary, and a genuinely escalatory event (Strait of Hormuz closure, refinery strike, regional state actor entering directly) would force a vol repricing that the dip-buy mechanic is not built for. The Iran war update 2026 tracker has the full chronology and the desk's read on what is and is not priced.
The MACRO MASTERY desk covers headline-driven repricing events live as the wires hit. The framework for separating habituated headlines from genuinely repricing events is one of the things the desk has refined over the last three months of Iran coverage.
The breadth problem nobody is talking about
Here is the part of the tape that worries the desk most. The S&P 500 record close is being delivered by an increasingly narrow leadership group. NDX up 0.54%, SPX up 0.23%, DJI down 0.32%. That is not a healthy breadth print on a record-close session.
In 2021 the same pattern preceded the late-2021 top by about four months. In 2024 the pattern showed up again in July before the August vol event. The historical setup is: index records on narrowing breadth, VIX subdued, mega-cap tech doing all the work, cyclicals lagging. The setup does not predict an immediate top, it predicts that the tape becomes increasingly vulnerable to a single-stock or single-sector shock that cascades through the index weighting.
The desk is not calling a top. We are flagging that the structural underpinnings of the dip-buy (Fed pivot, buybacks, vol-targeting, AI capex) are working brilliantly while the tactical breadth is deteriorating. Those two facts can coexist for months. They have, repeatedly. But when they resolve, they resolve quickly, and the resolution typically involves a sharp drawdown that tests every layer of the dip-buy bid before the structural floor reasserts.
Scenarios into the NY session
Scenario 1: Continuation grind (55%)
The dip-buy mechanic holds. SPX takes another swing at extending the record above 7,124, NDX leads further on AI-infrastructure bid, DJI continues to lag but does not collapse. VIX drifts toward 17.00 round support. The level the desk is watching as confirmation is SPX 7,150, a clean break above which extends the trend without breadth deterioration accelerating. Gold continues its grind toward the 4,750 round resistance as real yields keep compressing.
Scenario 2: Dip-buy audit (30%)
An intraday catalyst (Iran wire, regional Fed speaker walking back the dovish glide, an unexpected data print) produces a 1-1.5% SPX drawdown that tests the dip-buy mechanic. Price visits the 7,050 round level and the desk watches whether the institutional bid steps in cleanly or hesitates. A clean bid says the mechanic is intact, hesitation says the four underpinnings are starting to fray. VIX runs to 20 then mean-reverts on the bid.
Scenario 3: Breadth break (15%)
A single mega-cap tech print or sector shock cascades. SPX breaks 7,050 round support, then 7,000 psychological level. NDX gives up the 26,500 zone. VIX expands above 22. Gold catches a flight-to-quality bid above 4,750 even as equities sell. This is the breadth-resolution scenario, low probability today, structurally relevant over the next two to four weeks.
ASIC regulated. The desk's preferred broker for retail macro traders who want the MACRO MASTERY desk overlay alongside the platform.
Key levels worth watching
Key Levels Worth Watching
S&P 500 (current: 7,124.64):
- 7,150 round resistance: first round-number liquidity above current price, the natural magnet on continuation.
- 7,100 round support: the first audit of dip-buy conviction. A clean bid here keeps the mechanic intact.
- 7,050 round level: the deeper test. Below it, the breadth concerns become tactically actionable.
- 7,000 psychological: the round number that defined the late-April consolidation, defended three times before the breakout.
Nasdaq 100 (current: 26,923.65):
- 27,000 round resistance: the psychological extension target, first liquidity above.
- 26,500 round support: the AI-bid floor on recent pullbacks, watch for whether buyers step in defended-style here.
VIX (current: 17.92):
- 17.00 round support: below it, structural complacency consistent with continuation grind.
- 20.00 round resistance: the dip-buy-audit threshold. Above 20, the vol-targeting flows stop being net buyers.
Gold (current: $4,708.6):
- $4,750 round resistance: the next round magnet on the real-yield-compression continuation read.
- $4,700 round level: the round just broken, becomes first support on any pullback.
USDJPY (current: 157.74):
- 158.00 round resistance: the carry-trade extension level. Above it, equity risk gets a tailwind.
- 157.50 round support: the level the pair is currently sitting above, intervention chatter activates below.
The desk's live read on this tape
The five-lens framework that produced this analysis, plus the daily routine dashboard the desk runs every morning at 07:00 London, lives inside MACRO MASTERY. Live trade ideas, FOMC / NFP / CPI coverage as the prints land, BTC whale-flow signals, and a community of serious traders.
What would invalidate this view
What would force a reassessment
- A clean break of SPX 7,050 round support on volume. The dip-buy mechanic's first real audit since February. If the bid hesitates here, the four structural underpinnings are starting to question themselves.
- VIX expansion above 20.00 with no clean mean-reversion within the session. That stops the vol-targeted systematic bid and removes one of the four dip-buy legs.
- A hyperscaler capex walk-back. Any major AI-infrastructure customer cutting forward capex guidance unwinds the structural NDX bid independently of the macro tape.
- Genuine Iran escalation. Strait of Hormuz closure, refinery strike, direct state-actor involvement. The geopolitical tail that the tape is structurally underpricing.
- A Fed speaker walking back the disinflation glide path. Any meaningful pushback on the cutting cycle from a voting FOMC member would unwind the duration-substitute logic underpinning the equity bid. The official Fed speech calendar is the reference point.
- A CPI or PPI print that genuinely re-prices the OIS curve. Yesterday's hot services-ex-housing did not. A second consecutive hot print might. The BLS CPI release schedule matters for sequencing.
Final takeaway
The S&P 500 record close is structurally underpinned but tactically narrow.
The four mechanics that have made the dip-buy work since February (Fed-pivot pricing, corporate buybacks, vol-targeting flow, AI-infrastructure capex) are all still firing. They produced another record close yesterday through a hot CPI and an Iran rejection wire. That is real strength. But the breadth print on a record-close session, with DJI lagging at -0.32% while NDX leads at +0.54%, is the historical fingerprint of a tape that becomes increasingly fragile to a single-sector shock. The desk is not calling a top. The desk is calling out a tape that needs to be respected for what it is: a record-high index that survived two punches yesterday and is structurally bid for reasons that have not yet broken, sitting on its narrowest breadth in six months. The MACRO MASTERY desk walks through this live every morning, the daily macro pulse drops at 07:00 London.
"Record closes on narrowing breadth do not predict the top. They predict that when the top comes, it comes fast and audits every leg of the bid on the way down."
In short
Another S&P 500 record close at 7,124, with NDX leading at 26,923 on AI-infrastructure capex flow. Four structural underpinnings (Fed-pivot pricing, buybacks, vol-targeting, AI capex) are holding the dip-buy mechanic intact through CPI and Iran headlines. Breadth is the watch-out: DJI -0.32% on a record-close session is a fragility signal that needs the 7,050 round support to hold cleanly on the next pullback.
Educational analysis only. Past performance does not guarantee future results. Manage risk against your own portfolio.
ASIC regulated. Raw-spread ECN execution. Built for active intraday forex and index traders who care about cost per round-turn.
Join MACRO MASTERY
The institutional macro intelligence desk. The exact stack a hedge-fund analyst runs every morning, delivered into a Discord community of serious traders.
07:00 London daily macro pulse. Live trade ideas with entry, target, stop, invalidation. FOMC, NFP, CPI live coverage as the prints land. BTC whale-flow signals. G7 central-bank rate pricing. Weekly performance scorecard, every win AND loss.
Free for life through our Blueberry Markets partnership (ASIC regulated). Members trade through Blueberry, get the entire desk in return. Funds stay with the broker in your name, withdrawable any time. Pure alignment, not a subscription.
Welcome DM lands instantly. Non-US residents only for now, US partner Q3.
Related reading
- Real yields explained: the engine under every macro regime
- How to trade NFP: the institutional read
- BTCUSD and the major FX pairs hub
- Iran war update 2026: chronology and macro impact
- Dollar smile theory: when DXY rallies and why
Related from the desk
FAQ
What does the S&P 500 record close at 7,124 mean for the rest of 2026?
The S&P 500 record close at 7,124 confirms the structural bid that has framed every pullback since February remains intact. The four mechanics (Fed-pivot pricing, corporate buybacks, systematic vol-targeting flow, and AI-infrastructure capex) are all firing simultaneously. What matters for the rest of 2026 is whether those four stay correlated to the same underlying assumption that the Fed pivot holds. If they do, the dip-buy mechanic continues. If a Fed speaker walks back the disinflation glide path or CPI re-prices the OIS curve, all four mechanics unwind at once.
Why is the Nasdaq outperforming the Dow on a record-close session?
Nasdaq is outperforming because the AI-infrastructure capex cycle is a structural demand flow that operates independently of the broader macro tape. Hyperscaler guidance over the last two earnings cycles lifted forward capex commitments materially, and chip-supply normalisation has resolved the 2024-2025 bottleneck. Dow lags because cyclicals do not benefit from that AI capex bid and are more sensitive to the CPI sticky-print risk. The spread between NDX +0.54% and DJI -0.32% is the textbook narrow-leadership signal.
How did the S&P 500 record close survive a hot CPI print?
The CPI services-ex-housing component came in firm and produced a 30-minute intraday vol spike, but the bid stepped in and the index closed at a record. The mechanism: the market is no longer trading CPI as a Fed-reaction-function input. It is trading CPI as a confirmation of the disinflation glide path the Fed has already committed to. Real yields compressed despite nominal yields holding, which is the equity-friendly combination. Gold ripping to $4,708 on the same print confirmed the real-yield read.
Is VIX at 17.92 a complacency warning?
VIX at 17.92 looks like complacency on the surface but is consistent with what the desk calls a structurally underpriced tail regime, not a euphoria regime. The distinction matters. In a euphoria regime, VIX prints below 12 and there is no hedging bid. At 17.92 with a positive risk-event impulse, hedging is present but inexpensive, which is the historical setup for vol-targeted systematic strategies to be net buyers on any vol expansion that resolves quickly.
What is the dip-buy mechanic and is it retail or institutional?
The dip-buy mechanic that has framed the 2026 tape is fully institutional, not retail BTFD. It rests on four structural pillars: SOFR futures pricing the Fed cutting cycle continuation, corporate buyback authorisations running above consensus and executing mechanically on weakness, vol-targeted systematic strategies adding when realised vol compresses, and the AI-infrastructure capex bid that runs independent of the macro tape. All four are price-insensitive bidders inside defined windows.
What would force the S&P 500 record close trend to break?
The desk is watching five specific catalysts. A clean break of the 7,050 round support on volume. VIX expansion above 20 with no clean intra-session mean-reversion. A hyperscaler capex walk-back. Genuine Iran escalation (Strait of Hormuz closure, refinery strike, direct state-actor involvement). A Fed speaker walking back the disinflation glide path, or a second consecutive hot CPI print that re-prices the OIS curve. Any one of these unwinds at least one of the four dip-buy legs.
Why are gold and silver rallying alongside the equity record?
Gold at $4,708 (+0.66%) and silver at $88.07 (+3.45%) rallying with equities at records is the tell that real yields are doing the heavy lifting underneath both moves. When nominal yields hold and breakevens rise, real yields fall, which is bullish for both equities (lower discount rate) and precious metals (lower opportunity cost). It also signals that a chunk of capital is hedging the dollar-debasement and fiscal-dominance tail even while staying long risk, which is rational rather than bearish.
How is the Iran headline being priced in the current tape?
The Iran rejection that hit the wires before yesterday's open produced a 30-minute equity wobble that was bought, oil softening into the European afternoon, and the geopolitical premium leaking out of every asset except gold. The market is habituated to Iran headlines after months of similar prints, which is exactly the mechanism that made Russia-Ukraine headlines a non-event by mid-2023. The risk is that the tape is structurally underpricing the binary, and a genuinely escalatory event would force a vol repricing the dip-buy mechanic is not built for.
What does narrow breadth on a record-close session historically signal?
Historically, index records delivered on narrowing breadth (mega-cap tech leading, cyclicals lagging, VIX subdued) is the fingerprint of a tape that becomes increasingly vulnerable to a single-stock or single-sector shock. The 2021 setup preceded the late-2021 top by about four months. The 2024 setup preceded the August vol event. Narrow breadth does not predict an immediate top. It predicts that when the top comes, the resolution is sharp and audits every layer of the bid on the way down.
Where can I see the desk's live read on these levels?
The MACRO MASTERY desk runs the daily macro pulse at 07:00 London every morning, covers FOMC, NFP, and CPI prints live as the wires hit, and shares the five-lens framework that produced this analysis. Access is free for life through the Blueberry Markets partnership (ASIC regulated); funds stay with the broker in your name, fully withdrawable. The desk's Discord link is in the CTAs above. Non-US residents only currently; US partner expected Q3.
Sources: TwelveData and Yahoo Finance cross-verified spot for SPX, NDX, DJI, DAX, FTSE, NKY, DXY, VIX, EURUSD, GBPUSD, USDJPY, USDCHF, AUDUSD, NZDUSD, USDCAD, XAUUSD, XAGUSD, WTI, Brent (snapshot 2026-05-13T11:43Z). FRED for US Treasury real-yield context. Reuters, Bloomberg, FT, WSJ for CPI release readthrough and hyperscaler AI capex commentary. Federal Reserve speech calendar (federalreserve.gov) and BLS CPI release schedule (bls.gov) referenced for forward catalyst sequencing. Prior KenMacro coverage on real yields, the dollar smile, and the Iran chronology.
Continue reading